Download
1 / 19
190 likes | 313 Vues
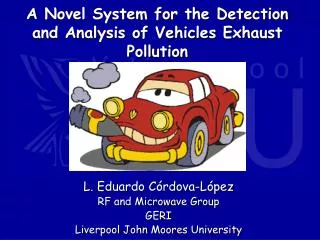
A Novel System for the Detection and Analysis of Vehicles Exhaust Pollution. L. Eduardo C ó rdova-López RF and Microwave Group GERI Liverpool John Moores University. Introduction. In UK 70% car increase (1982 – 2003) From 15.5 to 26.2 Million More Cars = More Pollution

E N D
A Novel System for the Detection and Analysis of Vehicles Exhaust Pollution L. Eduardo Córdova-López RF and Microwave Group GERI Liverpool John Moores University
Introduction • In UK 70% car increase (1982 – 2003) • From 15.5 to 26.2 Million • More Cars = More Pollution • What is in exhaust fumes? • 100’s of differently structured hydrocarbons • They burn in different ways and at different rates
Euro Standards • To preserve air quality • Emission req. in EU since early 70’s • Euro standards on emissions since 1993 • Further Euro standards Euro 2, 3 and 4 • Euro 5 to be implemented 2008 – 2010 • Similar standards are being implemented in different global regions
How can exhaust gases be measured? • It does not measure pollution • Zirconium dioxide element • It is a sort of “automatic choke” • Produces a voltage signal according to the amount of unburned oxygen • Engine’s air/fuel ratio adjusted to produce a more optimum burn • Ideal ratio Petrol = 14.7:1 • Lambda Sensor
How can exhaust gases be measured? • Kane-May Quintox’s • Electrochemical analyser • Absorbs air from the exhaust • Air passes through filters • Temperature • CO, O2, NO, NO2, SO2, HC…
How canexhaust gases be measured? • Array of single gas analysers (Turbines) ( Experimental ) • Laser induced incandescence (Conc. PM) • Fluorescence decay (Temp.) • Others mainly in the research area
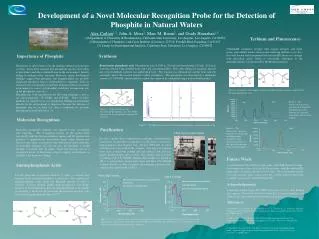
IR Spectroscopy • Gases absorb energy at specific frequencies • Chemical bonds at molecular level • Mid-IR “area of signature” (1500 – 500 cm-1) • Gases have unique signature • Absorption = Concentration
α Normal Fibre Optics • Very thin strands of pure glass used to transmit light signals • Core and cladding have diff. densities allowing total internal reflection • Mainly used in comms., but many more uses and research for new ones
Fiber Bragg Grating Grating lines half as far apart. Spacing = D/2 UV Laser Light Spacing = D Phase Mask Photosensitivity of Germanium dopant changed Imprint of Bragg Grating (Spectral Filter) on a fibre
Tests Setup • - Engine Mitsubishi • - Alternator Mecc Alte • Max Power 13 kW • Freq. 50 Hz • Load Output • 0% 0 kW • 25% 3.2 kW • 50% 6.5 kW • 75% 9.7 kW • 100% 13 kW
Depth Stop Probe with detachable steel shaft incorporates integral thermocouple Tests Setup
Controller Area Network • Developed in 1985 • Connects ECUs • Robust in EM noisy environments • Became ISO 11898 in 1993 • Increasingly adopted in industrial automation and control (robots, lifts, transportation systems, etc) BOSCH
Prototype’s Snapshot • Should fit nicely in the dashboard among other equally advanced instruments • Provides on-board, on-line measurement of exhaust output including temp. • Alarm LED actioned if/when average output goes above permitted levels • Possibility of outputting historical record to an HTML file
Urban Wireless Sensor Network • - Local Data collection • - Sensors strategically located • - Able to read each passing vehicle’s data • Map displays individual measurements for gases • 3 colours can represent level of gases • Data collated on tabular style for report
Work to be done (near future) • Continue test stage using engine • Investigate current technologies to measure PM • Study feasibility of implementation of measuring PM online • Investigation of Microwave Plasma for reduction of NOx and Nano Particulates
End Thanks very much for listening Please address queries to: L.E.Cordova-Lopez@2005.ljmu.ac.uk