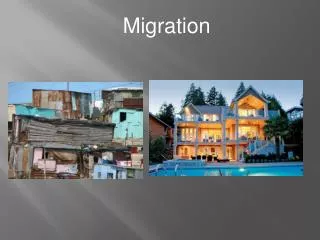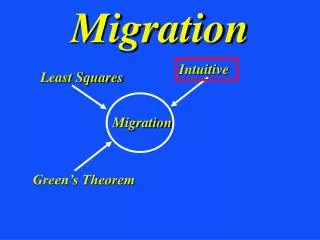
Migration
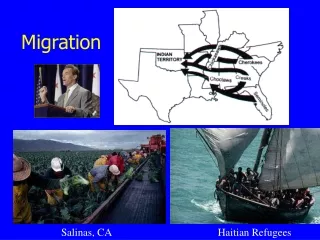
Migration. Salinas, CA. Haitian Refugees. Types of MOVEMENT. Activity/Action Space Cyclic Movement (class schedule) Commuting (suburb to city) Seasonal Movement (snowbirds) Nomadism (follow the herd) Periodic Movement (off to college). Migration Theory:.

Migration
E N D
Presentation Transcript
Migration Salinas, CA Haitian Refugees
Types of MOVEMENT Activity/Action Space • Cyclic Movement (class schedule) • Commuting (suburb to city) • Seasonal Movement (snowbirds) • Nomadism (follow the herd) • Periodic Movement (off to college)
Migration Theory: • Ernest George Ravenstein: The Laws of Migration, 1885 • Concerned with “absorption” and “dispersion” • Created his “Seven Laws of Migration” and recognized the inverse relationship between the volume of migration and the distance between source and destination… what would later be the basis for the Gravity Model of Migration.
Ravenstein’s Laws of Migration • Net migration amounts to a fraction of the gross migration (counter migration) • Most move a short distance. • Long-distance movers choose big cities • Urban dwellers are less migratory than rural. • Families are less likely to move international than young adults. This list are those that are still relevant today… some of Ravenstein’s other laws have either been discounted or absorbed into other laws.
The Gravity Model of Migration • Inverse relationship between volume of migration and distance between source and destination. • This interaction is predicted on the basis of size of the population in the respective places and the distance between them. So, spatial interaction is directly related to the populations and inversely to the distance… *see the handout
Factors Affecting Migration: • Distance: Absolute and Relative • Degree of Difference between SOURCE and DESTINATION • Flow of info between SOURCE and DESTINATION
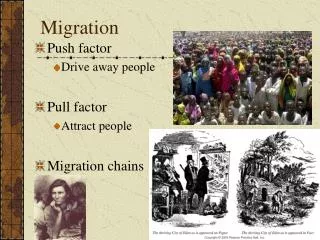
Why do people migrate? • Emigration and immigration • Change in residence. • Relative to origin and destination. • Push Factors • Pull Factors Major International Migration Patterns, Early 1990s Slide graphic courtesy of Dr. Jean-Paul Rodrigue, Hofstra University
3 Main Types of Push and Pull Factors • ECONOMIC -Jobs (availability, advancement) -Resources (land, natural resources) -Government Policy (ex. Homestead Act 1862) • CULTURAL -Political Instability PUSH (war, prejudice, refugees) -Political Stability PULL -Slavery more than 20 million people today live in some form of slavery • ENVIRONMENTAL -Health and Disease -Water (reliability) -Amenities (attractive scenery, beaches, climate…)
…or simply: The standard “catalysts of migration” apply: -Economic conditions -Politics -Armed Conflict -Environmental Conditions -Culture and Traditions -Technological Advances
Intervening Obstacles Intervening Obstacles Migrants can’t always go to the places they want – there may be obstacles in their way. Intervening obstacles may be either • Environmental • Cultural In the past, obstacles were mostly physical; today, they are mostly cultural.
Intervening Opportunity • “Life happens”… on your way to “make it in the big city”, but you stop along the way to make a few bucks waiting tables in some hick-town… 20 yrs later you’re still bussing tables for tips… that’s Intervening opportunity.
Types of Migration • Voluntary migration • The migrant makes the decision to move. • Most migration is voluntary. • Push and Pull Factors determine whom and where. • Forced Migration • Involuntary migration in which the mover has no role in the decision-making process. • Slavery. • About 11 million African slaves were brought to the Americas between 1519 and 1867. • In 1860, there were close to 4 million slaves in the United States. • Refugees. • Military conscription. • Children of migrants. Slide graphic courtesy of Dr. Jean-Paul Rodrigue, Hofstra University
Spring Summer Fall / Winter Types of Migration • Circular migration • A type of temporary migration. • Associated with agricultural work. • The migrant follows the harvest of various crops, moving from one place to another each time. • Very common in the US Southwest (Mexican farm workers) and in Western Europe (Eastern European farm workers).
Types of Migration • Sojourners • These workers intend to stay only until they save enough money to return to their homeland with wealth. • Common in the U.S. with Italians between 1890-1910. Common now with workers from Latin America. “Birds of Passage” • Remittances are a substantial part of the economy of some migrant source countries.
World Migration Routes Since 1700 European African (slaves) Indian Chinese Japanese Majority of population descended from immigrants Slide graphic courtesy of Dr. Jean-Paul Rodrigue, Hofstra University
Types of Migration: Internal Migration • Movement within a country from one region to another. *For what reasons might someone move to Florida? Why might people move away from Florida?
Internal Migrations in LDCs • Urbanization • migration from rural areas • lack of jobs in countryside • lack of services in cities • Tokyo, Los Angeles, and New York only MDC cities on top 10 list Populations in the less developed world are rushing to cities in search of work and income. Lagos, Nigeria Mumbai, India Mexico City, Mexico
Types of Migration: Step Migration • People tend to move shorter distances (due to distance decay) rather than make one long-distance move. As a result, migrants may move long distances, but in several shorter steps, only moving as they become familiar with their destination. (Nearness improves familiarity)
Current World Migration PatternsThis is a “GRADUATED CIRCLE MAP” (Thematic Map)
Types of Refugees • International • Intranational • Permanent • Temporary
World Refugee Patterns, 2007 (another Graduated Circle Map) Define: Repatriated Asylum
Slaves Reaching British North America, 1601-1867 (in 1,000s) Slide graphic courtesy of Dr. Jean-Paul Rodrigue, Hofstra University
Forced Migration The Trail of Tears, 1838
U.S. Immigration Ellis Island National Monument Prior to 1840, 90% of U.S.immigration was from Britain Two Big Waves: 1840 - 1930: W. and N. European transitioning to Southern and Eastern European by 1910 • Irish (potato famine in 1840s) and Germans • During 1900s: Italians, Russians, Austria-Hungary (Czech, Poland, Romania, etc.) • 1950 - Today: Asians and Latin Americans; declining Europeans • Asians: China, India; 1980s -1990s: Phillipines, Vietnam, and South Korea • Latin America: Mexico, Dom. Rep., El Salvador, Cuba, Haiti • 1986 Immigration Reform and Control Act: Public Law 99-603 (Act of 11/6/86), which was passed in order to control and deter illegal immigration to the United States. Its major provisions stipulate legalization of undocumented aliens who had been continuously unlawfully present since 1982, legalization of certain agricultural workers, sanctions for employers who knowingly hire undocumented workers, and increased enforcement at U.S. borders.
U.S. Immigration Prior to 1840, 90% of U.S.immigration was from Britain Three trends: Destinations of U.S. Immigrants - ethnic neighborhoods often result of chain migration • Mexicans: California, Texas, Illinois, New York • Caribbean: Florida or New York • Chinese and Indians: New York & California • Other Asians (Filipino, Vietnamese, etc.): California • Irish? • Italians? • Armenians? Ellis Island National Monument
Counter Migration • Result of governments sending back migrants caught entering their countries illegally. (repatriation)
U.S. Immigration Policies • 1882 Chinese Exclusion Act: Bars Asian immigration for ten years (extended) • 1921Quota Act - country by country quotas • 1924National Origins Act - country by country quotas • 1965Immigration Act - quotas for countries replaced, in 1968, with hemisphere quotas of 170, 000 for East and 120,000 for West • 1978Immigration Act - global quota of 290, 000 • 1980Refugee Act - quotas do not apply to those seeking political asylum • 1986Immigration Reform and Control Act admitted large numbers of former illegals. • 1990Immigration Act raised global quotas to roughly 675,000 • 1995, visas issued Preferentially: • 480,000 - to relatives of people here • 140,000 - to those with special skills and education • 55,000 - to diversity candidates (i.e., mostly not from Latin Amer. or Asia) Current Total: 675,000
US Population by Race and Ethnicity, 1990-2050 Slide graphic courtesy of Dr. Jean-Paul Rodrigue, Hofstra University
Top 10 Countries of Origin for US Legal Immigrants, 1998 Slide graphic courtesy of Dr. Jean-Paul Rodrigue, Hofstra University
Illegal Aliens in the United States by Country of Origin, 1996 (in 1,000s) Slide graphic courtesy of Dr. Jean-Paul Rodrigue, Hofstra University
Population Pyramid of Native and Foreign Born Population, United States, 2000 (in %) Foreign Born Native Male Female Age Male Female Slide graphic courtesy of Dr. Jean-Paul Rodrigue, Hofstra University
Types of Migration • Internal Migration • Within one country. • Crossing domestic jurisdictional boundaries; between states or provinces. • Little government control. • Factors: • Employment-based. • Retirement-based. • Education-based. • Civil conflicts (internally displaced population). Slide courtesy of Dr. Jean-Paul Rodrigue, Hofstra University
US Economic Regions Rustbelt: former industrial center trying to remake itself Sunbelt: service sector, biotec, communications
Voluntary African-American Migrations Blacks moved to The Industrial Belt (i.e., Chicago, New York, Detroit) and California during labor shortages (WWII). The culture of the receiving regions was affected by these changes. Can you think of specific cultural traits were added to the new regions by the arrival of large numbers of blacks?
Migration by Major Metropolitan Areas in the United States, 1990-98 (in 1,000s) Slide graphic courtesy of Dr. Jean-Paul Rodrigue, Hofstra University
Interregional Migrations U.S. population has been moving Westward and Southward • Gold Rush (1849) and Donner Party just the most dramatic examples of hardship. • Wells, Pumps, Aqueducts, Mosquito Control and Air Conditioning have allowed this move which otherwise would be impossible. • Loss of Industrial Jobs in east compliments increase in Sunbelt service sector (biotech, communications).
The Ten Fastest-Growing Metropolitan Areas, 1990–2000Source: U.S. Census Bureau, Census 2000; 1990 Census. Web: www.census.gov
Internal (interregional) Migrations in U.S. • Developed Countries: suburbanization • automobiles and roads • ‘American Dream’ • better services • counterurbanization • idyllic settings • cost of land for retirement • slow pace, yet high tech connections to services and markets U.S. population has been moving out of the city centers to the suburbs: suburbanization and counterurbanization U.S. intraregional migration during 1990s.