Weather Forecasting Methods and Surface Features | University of Illinois
Learn different forecasting methods including Persistence, Trends, and Other Methods. Understand surface features like Anticyclones, Cyclones, Fronts, and more. Expert knowledge courtesy of the University of Illinois.


Weather Forecasting Methods and Surface Features | University of Illinois
E N D
Presentation Transcript
Weather Forecasting Information Courtesy of: University of Illinois at Urbana-Champaign (http://ww2010.atmos.uiuc.edu/(Gh)/guides/mtr/fcst/home.rxml)
Forecasting Methods: Persistence Method • Simplest Method. • Assumes conditions won’t change from time of forecast. • Works well with patterns that change very little, or with slow moving weather patterns. • Works best for short-term forecasts. http://ww2010.atmos.uiuc.edu/(Gh)/guides/mtr/fcst/mth/prst.rxml
Forecasting Methods: Trends Method • Involves determining speed and direction of pattern movement. • If patterns speed up, slow down, change direction or change intensity, the trends method won’t work as well. Example: a storm system is 1000 miles west of your location and moving to the east at 250 miles per day, using the trends method you would predict it to arrive in your area in 4 days. Mathematics(1000 miles / 250 miles per day = 4 days) http://ww2010.atmos.uiuc.edu/(Gh)/guides/mtr/fcst/mth/trnd.rxml
Forecasting Methods: Other Methods • Climatology: averaging weather statistics over many years to forecast weather. • Analog Method: examining the current weather and thinking back to a past date where the weather was similar and then assuming the weather will behave the same way again. • Numerical Weather Prediction:using complex computer programs (forecast models)to predict weather based on equations and formulas.
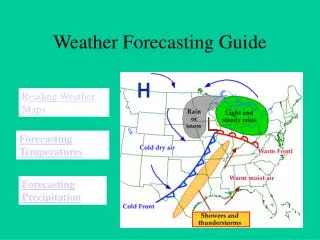
Surface Features • Anticyclones • Cyclones • Cold Fronts • Warm Fronts • Stationary Fronts • Occluded Fronts • Dry lines
Anticyclones • A high-pressure center where pressure has been measured to be highest to relative to its surroundings. • Moving any direction away from the “high” will result in decrease in pressure. • High pressure centers are generally centers of anticyclones. • High-pressure centers are represented by a blue “H”. http://ww2010.atmos.uiuc.edu/(Gh)/guides/mtr/fcst/sfc/hgh.rxml Think about it: Air diverges outward from a surface high. With air moving away from this region, air must sink to replace it. This sinking motion generally leads to fair skies and no precipitation.
Anticyclones • Winds flow clockwise around a high pressure center in the northern hemisphere. • Temperatures dependent upon location relative to high. • Northerly winds (approaching high) tend to bring colder temperatures • Southerly winds (backside of high) bring warming trend. http://ww2010.atmos.uiuc.edu/(Gh)/guides/mtr/fcst/sfc/hgh.rxml
Cyclones • Cyclone is an area of low pressure around which winds flow counterclockwise (in northern hemisphere). • Moving away from the low pressure center will result in increasing pressure. • Air converges into low pressure center causing air to rise. • Rising motion may produce clouds/precipitation http://ww2010.atmos.uiuc.edu/(Gh)/guides/mtr/fcst/sfc/lw.rxml
Cyclones • A “Low” is represented by a red “L” • As cyclone approaches, the likelihood of clouds/precipitation increases • Southerly winds (approaching cyclone) likely to result in warmer temperatures. • Northerly winds (backside of Low) typically result in cooling trend. http://ww2010.atmos.uiuc.edu/(Gh)/guides/mtr/fcst/sfc/lw.rxml
Cold Fronts • Cold Front: transition zone where cold air mass is replacing warmer air mass. • Air mass behind a cold front is generally cooler and drier than before the front. • If a cold front is approaching, precipitation is possible just before and while the front passes. • Behind the front: clearing skies, cooler temperatures, lower relative humidity. http://ww2010.atmos.uiuc.edu/(Gh)/guides/mtr/fcst/sfc/cfrnt.rxml -In this picture, temperatures ahead of the front are 55 and 62 degrees where behind the front, temperatures are 28 and 31 degrees.
Cold Front Diagram • As the cold air mass propagates, it lifts the warmer less dense air ahead of it (red arrows). • The air cools as it rises and the moisture condenses to produce clouds and precipitation ahead of and along the cold front. • In contrast to lifting along a warm front, upward motions along a cold front are typically more vigorous, producing deeper clouds and more intense bands of showers and thunderstorms. • These bands are often quite narrow (a couple hundred kilometers across) and move rapidly just ahead of the cold front. http://ww2010.atmos.uiuc.edu/(Gh)/guides/mtr/fcst/sfc/cfrnt.rxml
Warm Fronts • Warm Front: transitions zone where warm air mass is replacing a cold air mass. • Air behind a warm front is generally warmer and more moist than air ahead of it. • Before the front: light rain/winter precipitation possible • After the front: clearing skies, warmer temperatures and higher relative humidity. http://ww2010.atmos.uiuc.edu/(Gh)/guides/mtr/fcst/sfc/wfrnt.rxml -In the picture above, temperatures ahead of the front are 28 and 31 degrees where the temperatures behind the front are 55 and 62 degrees. This is a typical of warm fronts.
Warm Front Diagram • The surface of the warm front extends vertically into the atmosphere, sloping up and over colder air ahead of it. • Warm air rides up and over cold air mass, cooling as it rises, producing clouds/precipitation before the front. • Since lifting is gradual and steady, wide spread and light-intensity precipitation is typical before a warm front. http://ww2010.atmos.uiuc.edu/(Gh)/guides/mtr/fcst/sfc/wfrnt.rxml
Stationary Fronts • Stationary Front: a front that is not moving • Heavy amounts of precipitation possible if stationary front is nearby and a low pressure center is approaching. • Generally noticeable change and wind shift crossing from one side of the front to another. http://ww2010.atmos.uiuc.edu/(Gh)/guides/mtr/fcst/sfc/sfrnt.rxml -Stationary fronts are represented by alternating blue and red lines with blue triangles (pointed towards warmer air) and red semicircles (pointed towards colder air).
Occluded Fronts • Occluded Front: develops when a cold front catches a warm front. • With passage of an occluded front, weather conditions will likely turn from cool to cold. • Winds will swing around from easterly to westerly or southwesterly with rain/snow showers possible. http://ww2010.atmos.uiuc.edu/(Gh)/guides/mtr/fcst/sfc/ofrnt.rxml -Occluded fronts are represented by a solid purple line with alternating triangles and semicircles pointing the direction the front is moving. On colored weather maps, they are a solid purple line.
Dry Line (a moisture boundary) • Dry Line: a boundary separating a moist air mass from a dry air mass. (also called Dew Point front). • If a dry line is approaching your region, predict much drier air after the boundary moves through. • Storms are possible as the dry line approaches. • Temperatures tend to rise after the dry line passes. http://ww2010.atmos.uiuc.edu/(Gh)/guides/mtr/fcst/sfc/dfrnt.rxml Drylines are typically found east of the Rocky Mountains because it separates the warm, moist air mass to the east from the hot, dry air mass to the west.
Cloud Cover • When skies are clear, more heat reaches the earth’s surface causing warmer temperatures. • When it’s cloudy, some of the sun’s rays are reflected off the cloud droplets back into space causing cooler temperatures. http://ww2010.atmos.uiuc.edu/(Gh)/guides/mtr/fcst/tmps/cld.rxml -If cloud cover is expected during the day, predict cooler temperatures, but at night, cloud cover keeps temperatures warmer because less heat escapes back into the atmosphere.
Temperature Advection • Temperature Advection: refers to change in temperature caused by movement of air by wind. • To forecast using temperature advection, look at wind direction at your forecasting site and the temperatures upstream (direction from which the wind is blowing. • There is both cold and warm advection. http://ww2010.atmos.uiuc.edu/(Gh)/guides/mtr/fcst/tmps/ta.rxml -For example, above, assume that a temperature forecast is being made for the northern station. The northern station is cooler than the southern station, but the wind directions are the same, out of the south. The wind will transport the warmer air located at the southern station towards the northern station, so expect the temperature at the northern station to rise.
Effects of Snow Cover and Wind Snow Cover Wind -Wind forecast tip: on a windy night, some warmer air is mixed downward to the surface, which prevents the temperature from dropping as quickly as they would on a clear night. Predict warmer temperatures than on a clear night. http://ww2010.atmos.uiuc.edu/(Gh)/guides/mtr/fcst/tmps/snc.rxml -Snow cover forecast tip: predict lower daytime and nighttime temperatures than normal. http://ww2010.atmos.uiuc.edu/(Gh)/guides/mtr/fcst/tmps/wnd.rxml
Precipitation • When the dew point is close to the temperature, the air is nearly saturated and precipitation is possible. • When temperature and dew point are further apart, it means the air is quite dry.
Predicting Rain Vs. Snow http://ww2010.atmos.uiuc.edu/(Gh)/guides/mtr/fcst/prcp/rs.rxml
Summary • By combining all of the techniques given, you should be able to create more accurate forecasts. • Now let’s practice your forecasting!