Download
1 / 1
20 likes | 228 Vues
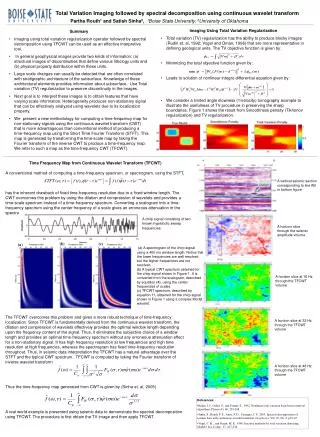
Total Variation Imaging followed by spectral decomposition using continuous wavelet transform Partha Routh 1 and Satish Sinha 2 , 1 Boise State University, 2 University of Oklahoma. Imaging Using Total Variation Regularization

E N D
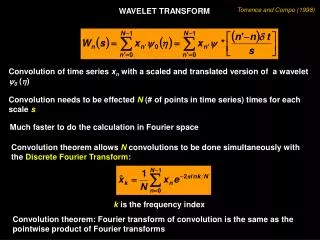
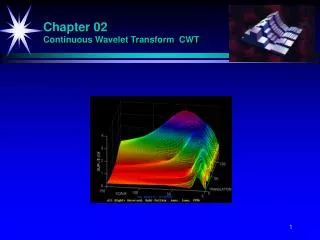
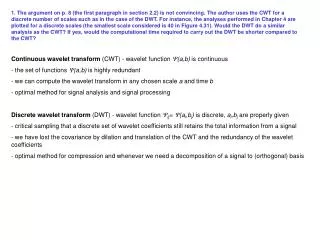
Total Variation Imaging followed by spectral decomposition using continuous wavelet transform Partha Routh1 and Satish Sinha2, 1Boise State University, 2University of Oklahoma • Imaging Using Total Variation Regularization • Total variation (TV) regularization has the ability to produce blocky images (Rudin et. al, 1992; Vogel and Oman, 1996) that are more representative in defining geological units. The TV objective function is given by: • Minimizing the total objective function given by: • Leads to solution of nonlinear integro-differential equation given by: • We consider a limited angle slowness (1/velocity) tomography example to illustrate the usefulness of TV procedure in preserving the sharp boundaries. Figure 1 shows the result from Smoothness penalty (Tikhonov regularization) and TV regularization. • Summary • Imaging using total variation regularization operator followed by spectral decomposition using TFCWT can be used as an effective interpretive tool. • In general geophysical images provide two kinds of information: (a) structural images of discontinuities that define various lithology units and (b) physical property distribution within these units. • Large scale changes can usually be detected that are often correlated with stratigraphic architecture of the subsurface. Knowledge of these architectural elements provides information about subsurface. Use Total variation (TV) regularization to preserve discontinuity in the images. • Next goal is to interpret these images is to obtain features that have varying scale information. Heterogeneity produces non-stationary signal that can be effectively analyzed using wavelets due to its localization property. • We present a new methodology for computing a time-frequency map for non-stationary signals using the continuous wavelet transform (CWT) that is more advantageous than conventional method of producing a time-frequency map using the Short Time Fourier Transform (STFT). This map is generated by transforming the time-scale map by taking the Fourier transform of the inverse CWT to produce a time-frequency map. We refer to such a map as the time-frequency CWT (TFCWT). Time Frequency Map from Continuous Wavelet Transform (TFCWT) A conventional method of computing a time-frequency spectrum, or spectrogram, using the STFT, has the inherent drawback of fixed time-frequency resolution due to a fixed window length. The CWT overcomes this problem by using the dilation and compression of wavelets and provides a time-scale spectrum instead of a time-frequency spectrum. Converting a scalogram into a time-frequency spectrum using the center frequency of a scale gives an erroneous attenuation in the spectrum. The TFCWT overcomes this problem and gives a more robust technique of time-frequency localization. Since TFCWT is fundamentally derived from the continuous wavelet transform, the dilation and compression of wavelets effectively provides the optimal window length depending upon the frequency content of the signal. Thus, it eliminates the subjective choice of a window length and provides an optimal time-frequency spectrum without any erroneous attenuation effect for a non-stationary signal. It has high frequency resolution at low frequencies and high time resolution at high frequencies, whereas the spectrogram has fixed time-frequency resolution throughout. Thus, in seismic data interpretation the TFCWT has a natural advantage over the STFT and the typical CWT spectrum. TFCWT is computed by taking the Fourier transform of inverse wavelet transform Thus the time-frequency map generated from CWT is given by (Sinha et. al, 2005) A real world example is presented using seismic data to demonstrate the spectral decomposition using TFCWT. The procedure is first obtain the TV image and then apply TFCWT. A vertical seismic section corresponding to line AB in bottom figure A chirp signal consisting of two known hyperbolic sweep frequencies. A horizon slice through the seismic amplitude volume (b) (c) (a) (a) A spectrogram of the chirp signal using a 400 ms window length. Notice that the lower frequencies are well resolved but the higher frequencies are not resolved (b) A typical CWT spectrum obtained for the chirp signal shown in Figure 1. It is converted from the scalogram, described by equation (4), using the center frequencies of scales. (c) TFCWT spectrum, described by equation 11, obtained for the chirp signal shown in Figure 1 using a complex Morlet wavelet. A horizon slice at 16 Hz through the TFCWT volume A horizon slice at 32 Hz through the TFCWT volume A horizon slice at 48 Hz through the TFCWT volume • References: • Rudin, I. I., Osher, S., and Fatemi, E., 1992, Nonlinear total variation based noise removal algorithms, Physica D, 60, 259-268. • Sinha, S., Routh, P. S., Anno, P. D., Castagna, J. P., 2005, Spectral decomposition of seismic data with continuous-wavelet transform, Geophysics, Vol. 70, No. 6, p19-25. • Vogel, C. R.,, and Oman, M. E., 1996, Iterative methods for total variation denoising, SIAM J. Sci. Comp., 17, 227-238.