Download
1 / 12
120 likes | 231 Vues
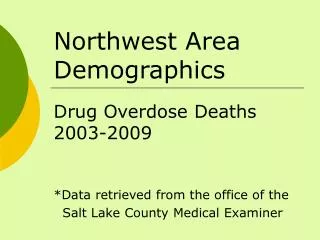
This report examines drug overdose deaths in the Northwest area between 2003 and 2009, utilizing data from the Salt Lake County Medical Examiner's Office. It explores demographics, including age, gender, and race/ethnicity. Key findings show significant drug-related deaths across various zip codes, with notable differences in the utilization of prescription versus illicit drugs. The report highlights the challenges in determining causes of death and the demographic breakdown of those affected, revealing critical insights into substance use trends in the region.

E N D
Northwest Area Demographics Drug Overdose Deaths 2003-2009 *Data retrieved from the office of the Salt Lake County Medical Examiner
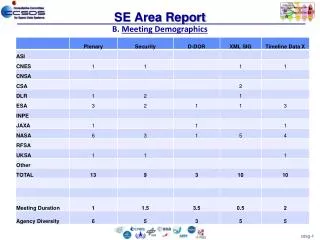
From the ME Data • Involving Illicit drugs • Age • Gender • Race/Ethnicity • Black, White, Caucasian, Pacific islander, Unsure • Location of Death vs. Residence
What we don’t get • The “Cause” is not always clear • Morphine/heroin conundrum • Current prescription • “Hispanic/Latino”
Undetermined/Accidental Deaths • 84116 had 70 total deaths • 37 (53%) were drug related • 22 involved prescription drugs • 84104 had 51 total deaths • 27 (53%) were drug related • 13 involved prescription drugs • 2 were unclassified • 84101 had 37 total deaths • 16 (43%) were drug related • 5 involved prescription drugs
Drug Overdose Deaths 2003-2009
51 Male – 64% 84116-25 84104-14 84101-12 29 Female – 36% 84116-12 84104-13 84101-4 Rx ratio ≈ 50% male Male: 16 Female: 15 Rx+Illicit ratio ≈ 66% Male: 6 Female: 3 Illicit ratio ≈ 75% Male: 28 Female: 10 Gender Breakdown
Range: 16-62 yrs Male average: 40.7 Female average: 41.1 Rx average Male: 39.6 Female: 44.9 Rx+Illicit average Male: 40.3 Female: 40 Illicit average Male: 38.2 Female: 44.9 Age Data
Race/Ethnicity • White/Caucasian: 72 90% • Black: 4 5% • Pacific Islander: 2 2.5% • Native American: 1 1.3% • Unsure: 1 1.3% 80 100%
Other Info • Non-resident deaths • 84116 – 4 • 84104 – 6 • 84101 – 9 (2 unclassified)