
MOS Performance
E N D
Presentation Transcript
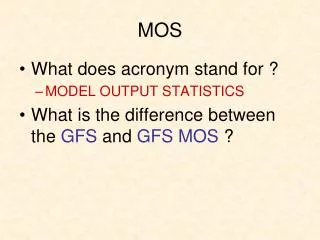
MOS Performance • MOS significantly improves on the skill of model output. • National Weather Service verification statistics have shown a narrowing gap between human and MOS forecasts.
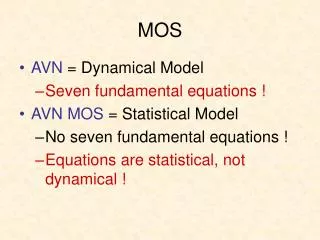
Global Ensemble MOS • Ensemble MOS forecasts are based on the 0000 UTC run of the GFS Global model ensemble system. These runs include the operational GFS, a control version of the GFS (run at lower resolution), and 20 bred perturbation runs. • Older operational GFS MOS prediction equations are applied to the output from each of the ensemble runs to produce 21 separate sets of alphanumeric bulletins in the same format as the operational MEX message.
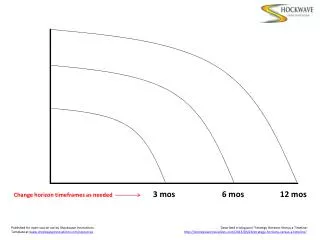
Gridded MOS • The NWS needs MOS on a grid for many reasons, including for use in their IFPS analysis/forecasting system. • The problem is that MOS is only available at station locations. • A very recent project is to create Gridded MOS. • Takes MOS at individual stations and spreads it out based on proximity and height differences. Also does a topogaphic correction dependent on reasonable lapse rate.
Cool Season Mi. Temp – 12 UTC Cycle Average Over 80 US stations
Prob. Of Precip.– Cool Season(0000/1200 UTC Cycles Combined)
MOS Won the Department Forecast Contest in 2003 For the First Time!
Average or Composite MOS • There has been some evidence that an average or consensus MOS is even more skillful than individual MOS output. • Vislocky and Fritsch (1997), using 1990-1992 data, found that an average of two or more MOS’s (CMOS) outperformed individual MOS’s and many human forecasters in a forecasting competition.
Some Questions • How does the current MOS performance…driven by far superior models… compare with NWS forecasters around the country. • How skillful is a composite MOS, particularly if one weights the members by past performance? • How does relative human/MOS performance vary by forecast projection, region, large one-day variation, or when conditions vary greatly from climatology? • Considering the results, what should be the role of human forecasters?
This Study • August 1 2003 – August 1 2004 (12 months). • 29 stations, all at major NWS Weather Forecast Office (WFO) sites. • Evaluated MOS predictions of maximum and minimum temperature, and probability of precipitation (POP).
Forecasts Evaluated • NWS Forecast by real, live humans • EMOS: Eta MOS • NMOS: NGM MOS • GMOS: GFS MOS • CMOS: Average of the above three MOSs • WMOS: Weighted MOS, each member is weighted by its performance during a previous training period (ranging from 10-30 days, depending on each station). • CMOS-GE: A simple average of the two best MOS forecasts: GMOS and EMOS
The Approach: Give the NWS the Advantage! • 08-10Z-issued forecast from NWS matched against previous 00Z forecast from models/MOS. • NWS has 00Z model data available, and has added advantage of watching conditions develop since 00Z. • Models of course can’t look at NWS, but NWS looks at models. • NWS Forecasts going out 48 (model out 60) hours, so in the analysis there are: • Two maximum temperatures (MAX-T), • Two minimum temperatures (MIN-T), and • Four 12-hr POP forecasts.
Temperature MAE (F) for the seven forecast types for all stations, all time periods, 1 August 2003 – 1 August 2004.
Large one-day temp changes MAE for each forecast type during periods of large temperature change (10F over 24-hr), 1 August 2003 – 1 August 2004. Includes data for all stations.
MAE for each forecast type during periods of large departure (20F) from daily climatological values, 1 August 2003 – 1 August 2004.
Number of days each forecast is the most accurate, all stations. In (a), tie situations are counted only when the most accurate temperatures are exactly equivalent. In (b), tie situations are cases when the most accurate temperatures are within 2F of each other. Looser Tie Definition
Number of days each forecast is the least accurate, all stations. In (a), tie situations are counted only when the least accurate temperatures are exactly equivalent. In (b), tie situations are cases when the least accurate temperatures are within 2F of each other. Looser Tie Definition
Highly correlated time series Time series of MAE of MAX-T for period one for all stations, 1 August 2003 – 1 August 2004. The mean temperature over all stations is shown with a dotted line. 3-day smoothing is performed on the data.
Coldspell Time series of bias in MAX-T for period one for all stations, 1 August 2003 – 1 August 2004. Mean temperature over all stations is shown with a dotted line. 3-day smoothing is performed on the data.
MAE for all stations, 1 August 2003 – 1 August 2004, sorted by geographic region. MOS Seems to have the most problems at high elevation stations.
Bias for all stations, 1 August 2003 – 1 August 2004, sorted by geographic region.
Brier Scores for Precipitation for all stations for the entire study period.
Brier Score for all stations, 1 August 2003 – 1 August 2004. 3-day smoothing is performed on the data.
Precipitation Brier Score for all stations, 1 August 2003 – 1 August 2004, sorted by geographic region.
Reliability diagrams for period 1 (a), period 2 (b), period 3 (c) and period 4 (d).
The End http://www.atmos.washington.edu/~jbaars/mos_vs_nws.html