Automated Problem Diagnosis for Production Systems
150 likes | 289 Vues
This paper discusses an automated problem diagnosis framework aimed at addressing the complexities that arise in large-scale production systems. With the increasing scale and complexity of these systems, traditional manual diagnosis becomes insufficient, leading to significant challenges for administrators. The solution presented uses a combination of instrumentation, statistical analysis, and anomaly detection techniques to proactively identify and visualize problems, enhancing failure detection and prediction. The implementation, validated through real-world VoIP data, demonstrates significant improvements in diagnosing chronic issues within production environments.

Automated Problem Diagnosis for Production Systems
E N D
Presentation Transcript
Automated Problem Diagnosis for Production Systems Soila P. Kavulya Scott Daniels (AT&T), Kaustubh Joshi(AT&T), MattiHiltunen(AT&T), Rajeev Gandhi (CMU),PriyaNarasimhan (CMU) PARALLEL DATA LABORATORY Carnegie Mellon University
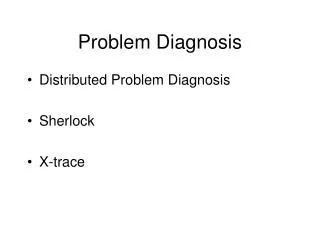
Automated Problem Diagnosis http://www.pdl.cmu.edu/ • Diagnosing problems • Creates major headaches for administrators • Worsens as scale and system complexity grows • Goal: automate it and get proactive • Failure detection and prediction • Problem determination (or “fingerpointing”) • Problem visualization • How: Instrumentation plus statistical analysis
Target Systems for Validation http://www.pdl.cmu.edu/ • VoIP system at large telecom provider • 10s of millions of calls per day, diverse workloads • 100s of heterogeneous network elements • Labeled traces available • Hadoop: MapReduce implementation • Hadoopclusters with homogeneous hardware • Yahoo! M45 & Opencloud production clusters • Controlled experiments in Amazon EC2 cluster • Long running jobs (> 100s): Hard to label failures
Assumptions of Approach http://www.pdl.cmu.edu/ • Majority of system is working correctly • Problems manifest in observable behavioral changes • Exceptions or performance degradations • All instrumentation is locally timestamped • Clocks are synchronized to enable system-wide correlation of data • Instrumentation faithfully captures system behavior
Overview of Diagnostic Approach Application Logs End-to-end Trace Construction Anomaly Detection Localization Performance Counters Ranked list of root-causes http://www.pdl.cmu.edu/
Anomaly Detection Overview http://www.pdl.cmu.edu/ • Some systems have rules for anomaly detection, e.g., • Redialing number immediately after disconnection • Server reported error codes and exceptions • If no rules available, rely on peer-comparison • Identifies peers (nodes, flows) in distributed systems • Detect anomalies by identifying “odd-man-out”
Anomaly Detection Approach Faulty node Normal node Normal node Normalized counts (total 1.0) Normalized counts (total 1.0) Normalized counts (total 1.0) Histograms (distributions) of durations of flows • Histogram comparison identifies anomalous nodes • Pairwise comparison of node histograms • Detect anomaly if difference between histograms exceeds pre-specified threshold http://www.pdl.cmu.edu/
Localization Overview http://www.pdl.cmu.edu/ • Obtain labeled end-to-end traces (labels indicate failures and successes) • Telecom systems • Use heuristics, e.g., Redialing number immediately after disconnection • Hadoop • Use peer-comparison for anomaly detection since heuristics for detection are unavailable • Localize source of problems • Score attributes based on how well they distinguish failed calls from successful ones
“Truth Table” Call Representation Log Snippet Call1: 09:31am,SUCCESS, Server1,Server2,Phone1 Call2: 09:32am,FAIL,Server1,Customer1,Phone1 10s of thousands of attributes 10s of millions of calls http://www.pdl.cmu.edu/
Identify Suspect Attributes Failure|Customer1 Success|Customer1 Anomaly score: Distance between distributions Degree of Belief Probability http://www.pdl.cmu.edu/ • Estimate conditional probability distributions • Prob(Success|Attribute) vsProb(Failure|Attribute) • Update belief on distribution with each call seen
Find Multiple Ongoing Problems UI: Ranked list of chronics 1. Chronic signature1 Customer1 ServerOS4 2. Chronic signature2 PhoneType7 Time of Day (GMT) Failed Calls http://www.pdl.cmu.edu/ • Search for combination of attributes that maximize anomaly score • E.g., (Customer1 and ServerOS4) • Greedy search limits combinations explored • Iterative search identifies multiple problems
Evaluation http://www.pdl.cmu.edu/ • Prototype in use by Ops team • Daily reports over past 2 years • Helped Ops to quickly discover new chronics • For example, to analyze 25 million VoIP calls • 2 2.4GHz Xeon cores, used <1 GB of memory • Data loading: 1.75 minutes for 6GB of data • Diagnosis: ~4 seconds per signature (near-interactive)
Call Quality (QoS) Violations Incident at ISP: 1. ChronicSignature1 Service_A Customer_A 2. ChronicSignature2 Service_A Customer_N IP_Address_N Message loss used as the event failure indicator (>1%) Draco showed most QoS issues were tied to specific customers and not ISP network elements (as was previously believed) Failed Calls Time of Day (GMT) Failed Calls Time of Day (GMT) Customer name, IP http://www.pdl.cmu.edu/
In Summary… http://www.pdl.cmu.edu/ • Use peer-comparison for anomaly detection • Localize source of problems using statistics • Applicable when end-to-end traces available • E.g., customer, network element, version conflicts • Approach used on Trone might vary • Depends on instrumentation available • Also depends on fault-model