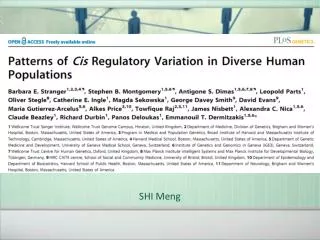
Investigating Gene Expression Variation Across Global Populations and Its Regulatory Implications
This study explores the genetic basis and variability of gene expression across eight global populations using lymphoblastoid cell lines from 726 individuals. We identify 5,691 expression quantitative trait loci (eQTLs) and highlight the influence of ancestry on gene expression levels. Our results show significant eQTL sharing, especially among Asian, European-admixed, and African subpopulations, providing insights into the complex trait variants’ transferability. This research enhances our understanding of regulatory variants affecting gene expression and their implications in disease.

Investigating Gene Expression Variation Across Global Populations and Its Regulatory Implications
E N D
Presentation Transcript
Abstract • The genetic basis of gene expression variation has long been studied with the aim to understand the landscape ofregulatory variants, but also more recently to assist in the interpretation and elucidation of disease signals. To date, manystudies have looked in specific tissues and population-based samples, but there has been limited assessment of the degreeof inter-population variability in regulatory variation. We analyzed genome-wide gene expression in lymphoblastoid celllines from a total of 726 individuals from 8 global populations from the HapMap3 project and correlated gene expressionlevels with HapMap3 SNPs located in cis to the genes. We describe the influence of ancestry on gene expression levelswithin and between these diverse human populations and uncover a non-negligible impact on global patterns of geneexpression. We further dissect the specific functional pathways differentiated between populations.
Abstract • We also identify 5,691expression quantitative trait loci (eQTLs) after controlling for both non-genetic factors and population admixture andobserve that half of the cis-eQTLs are replicated in one or more of the populations. We highlight patterns of eQTL-sharingbetween populations, which are partially determined by population genetic relatedness, and discover significant sharing ofeQTL effects between Asians, European-admixed, and African subpopulations. Specifically, we observe that both the effectsize and the direction of effect for eQTLs are highly conserved across populations. We observe an increasing proximity ofeQTLs toward the transcription start site as sharing of eQTLs among populations increases, highlighting that variants closeto TSS have stronger effects and therefore are more likely to be detected across a wider panel of populations. Togetherthese results offer a unique picture and resource of the degree of differentiation among human populations in functionalregulatory variation and provide an estimate for the transferability of complex trait variants across populations.
Background • Human population differentiation • Neutral DNA sequence • functional variants • non-synonymous variants • eQTLs • Previous eQTLs studies • limited to only several well-defined populations • have not contrasted geographically proximate populations • first analysis of eQTL differentiation among eight human population samples
Materials • LCLs (lymphoblastoid cell lines) • Samples: • 726 individuals of 8 HapMap populations • Expression data: • Sentrix Human-6 Expression BeadChip version 2 • 47,294 transcripts, plus controls • 21,800 probes: 18,226 unique autosomal Ensembl genes • Genotype data: • MAF > 0.05, < 20% missing data • 1.1 million ~ 1.3 million per population
Methods • Raw expression data normalization • log2 scale • quantile normalization across replicates of a single individual • mean normaliztion across all individuals of the eight populations • Population stratification correction of expression data • Admixed populations: GIH, LWK, MEX, MKK • EIGENSTRAT: princinple components based on genotype • Expression values were adjusted for each population using ten primary axes of variation form corresponding intra-population PCA
Methods • Correction for known and unknown factors: ‘‘REDUCED’’ dataset generation • probabilistic estimation of expression residuals (PEER) framework • Structure of gene expression variation among populations • Vst: (VT - VS)/VT; VS =(V1*n1+V2*n2)/(n1+n2) • top 5% probes: GO term enrichments
Methods • Association and multiple-test correction (individualpopulations) • cis: <= 1Mb from TSS • Association: Spearman Rank Correlation (SRC) model • significance accessment • 10,000 permutations of each phenotype (probe) relative to the genotypes • threshold: 0.01 • FDR: • 1 - (the number of genes with replication/total number of significant genes)
Methods • Stepwise association model • determine whether independent cis- regulatory signals existfor a given gene • Steps: • regressed out of the expression levels the effect of the most-significant SNP • re-ran the SRC analysis • stored those SNPs with p-values more significant than the gene’s permutation threshold • repeated until there were no SNPs from the initial significant eQTL list left to test
Results • Structure of gene expression variation among populations • expression- based PCA plot: not separate distinctly • Vst: • Vst values: heavily skewed toward values near 0 • the amount of VST between a pair of populations is correlated with the degree of genetic distance • the vast majority of genes do not exhibit highly differentiated expression variation between populations • probes exhbiting top 5% Vst scores: enriched in GO terms • significant population-specific GO term enrichment • GO terms corresponding to genes significantly diverged in expression in one population are also diverged in expression in the other, closely-related populations
Results • Cis associations of gene expression with SNPs
Results • Multiple effects underlying cis-eQTLs • at least two significant cis-eQTL SNPs at the 0.01 permutation threshold • a total of 33 (0~2% for 8 populations) genes with multiple eQTLs • At most, a single gene had five independently associated SNPs
Results • Population sharing of cis-eQTLs • 1,074 (34%) of 3130 genes had a significant cis-eQTL in at least two populations • more closely-related populations tend to share more cis- associated genes than more distantly-related populations • 98.9–100% concordance of allelic direction • effect size (fold difference between homozygotes of the two different genotypic states of a SNP) is shared between any two populations when the association is also shared • the discovery of an eQTL mainly due to allele frequency differences, not due to differences in absolute effect size
Results • Genomic properties of eQTLS • majority of association signals are approximately symmetrically centered on the TSS • the strongest statistical signals located directly at the TSS • population sharing increases from in only one population to all eight populations,s gradual tightening of the distribution around the TSS • SNPs associated with more than one gene • 264 genes • 52 clusters of 2 or more genesin at least two populations • the distance to TSS: larger
Results • eQTLs and disease • 62 SNPs from GWAS catalog • the most-significant SNP of a cis-eQTL in at least one population • 57 Ensembl genes, and 51 traits • Alcohol dependence, Crohn’s disease, ... • 15 (24%) were the most significant SNP of the same gene in at least one additional population • assist in fine-mapping causal variants for complex traits
Disscussion • extensive sharing of eQTLs across human populations • effect size and the direction of effect for eQTLs: highly conserved • symmetric distribution of eQTLs around the TSS • additional cell types under a variety different cellular and developmental conditions • how the frequency spectrum of regulatory variants has been shaped by selective and demographic processes • how these functional variants contribute to higher order phenotypes • methods to preprocess microarray data and detect eQTLs • comprehensive analysis of eQTLs and functional association