Vegetation Change Over 25 Years Along the Tanana River: A Successional Chronosequence Study
This study investigates vegetation changes along the Tanana River over 25 years, focusing on a hypothesized successional chronosequence. By analyzing overstory and understory vegetation densities and compositions, the research assesses the expected and observed trajectories of species density, including willows, Populus balsamifera, and Picea species. The results reveal significant variability in species recruitment, highlighting discrepancies with traditional successional models and providing insight into the dynamics at play in boreal ecosystems.

Vegetation Change Over 25 Years Along the Tanana River: A Successional Chronosequence Study
E N D
Presentation Transcript
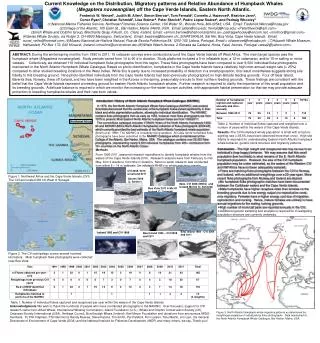
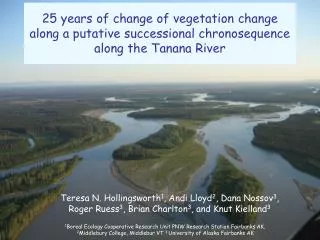
25 years of change of vegetation change along a putative successional chronosequence along the Tanana River Teresa N. Hollingsworth1, Andi Lloyd2, Dana Nossov3, Roger Ruess3, Brian Charlton3, and Knut Kielland3 1Boreal Ecology Cooperative Research Unit PNW Research Station Fairbanks AK, 2Middlebury College, Middlebur VT 3 University of Alaska Fairbanks AK
Drury 1956 Introduction Methods Results: Density Results: Composition Conclusions
Introduction Methods Results: Density Results: Composition Conclusions
Research Question • Are the hypothesized turning points manifested in changes in vegetation, both overstory and understory? • Does our chronosequence accurately defined the vegetation change observed? Introduction Methods Results: Density Results: Composition Conclusions
Trend differs than expected successional trajectory. Trend is synchronous among sites. Introduction Methods Results: Density Results: Composition Conclusions
Results: Species density (Willows) Introduction Methods Results: Density Results: Composition Conclusions
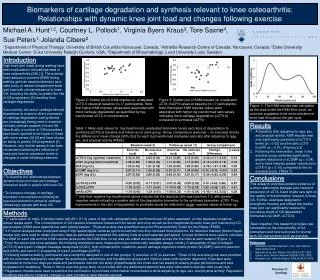
Results: Species density (Populus Balsamifera) Overstory trees Seedlings/Saplings Introduction Methods Results: Density Results: Composition Conclusions
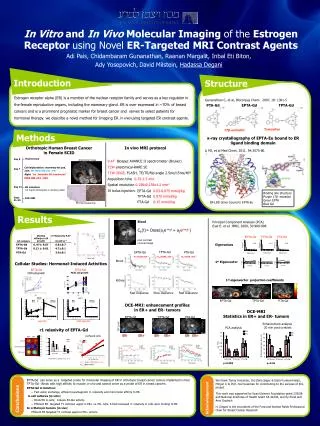
Results: Species density (Picea glauca) Seedlings/Saplings Overstory trees Introduction Methods Results: Density Results: Composition Conclusions
Results: Species density (Picea mariana) Seedlings/Saplings Introduction Methods Results: Density Results: Composition Conclusions
Results: Early succesional species density • Predicted: S&S of PB and Willow densities will increase in the 0s through the 1s and decrease in the 2s, 3s, 4s, and 5s. • Observed: 5 of the 6 “early” species reached maximum abundance at site FP1. • 1 of the 6 “early” species reached a maximum abundance at FP0 (SALINT). • Overall, then, early species generally conformed with the predictions of the successional chronosequence. Introduction Methods Results: Density Results: Composition Conclusions
Results: Mid successional species density • Populus balsamifera trees • Predicted: Abundance will increase at the 2s and decrease at the 3s • Observed: Abundance decreased at the 3s, but the 2s experienced stochastic variability • Picea glauca seedlings/saplings • Predicted: Abundance will increase at sites FP1-FP3, and decline at FP4. • Observed: Abundance increased at FP0 and FP2, declined at FP3 and FP4, and increased/declined at FP1. Introduction Methods Results: Density Results: Composition Conclusions
Results: Late successional species densities • Picea glauca trees • Predicted: Abundance will increase at the 3s and decrease at the 4s • Observed: No significant change in density at the 3s or 4s • Picea mariana seedlings/saplings • Predicted: Abundance will increase at the 4s • Observed: No significant recruitment Introduction Methods Results: Density Results: Composition Conclusions
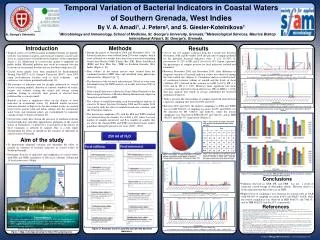
Results: Species composition Axis 2 Axis 1 Introduction Methods Results: Density Results: Composition Conclusions
Conclusions • Early successional understory species (woody and nonwoody) by and large conform to our expectations. However, late successional understory species do not. • There have been significant declines in tall woody plants and forbs in the late stages of recent years, which have not been compensated for by new arrivals and are, therefore, potentially becoming less abundant on the landscape than they were. • Black spruce is not recruiting in mature white spruce stands, and doesn’t appear to be a “final” stage of floodplain succession. Only some of the “turning points” in succession are actually succeeding in a predictable pattern Introduction Methods Results: Density Results: Growth Conclusions
Conclusions • There is a large amount of variability in species composition that is not explained by the traditional successional paradigm. Introduction Methods Results: Abundance Results: Growth Conclusions
Acknowledgements Bonanza Creek LTER (Long-Term Ecological Research) US Forest Service, PNW Research Station Jamie Hollingsworth, Jason Downing, and Dana Nossov Field crews through the years