Exploring Probability: Games, Insurance, and Family Data
This resource covers key concepts in probability through engaging examples. Start with a game of Bop-It where you explore all possible outcomes and their probabilities. Progress to rolling two dice and calculating various outcomes based on sums. Then, dive into real-life applications using an insurance scenario to assess profit potential based on death and disability probabilities. Lastly, understand data organization with two-way tables and Venn diagrams, using familial relationships to illustrate the principles. Ideal for students and anyone interested in probability.

Exploring Probability: Games, Insurance, and Family Data
E N D
Presentation Transcript
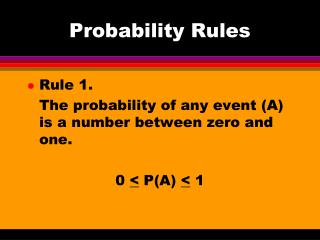
Ch. 7 Probability Rules Day 1
Ex 1: You’re playing Bop-It with your friend. Suppose that each option to either “bop it,” “twist it,” or “pull it” has equal probability. You take two turns by yourself- write down all the possible outcomes. • List all possible outcomes in the Sample Space: • Let B= bop it, T= twist it, P= pull it All options: BB TP PB BT TB PT BP TT PP b. What is the probability of each option?
Ex 1: You’re playing Bop-It with your friend. Suppose that each option to either “bop it,” “twist it,” or “pull it” has equal probability. You take two turns by yourself- write down all the possible outcomes. All options: BB TP PB BT TB PT BP TT PP c. Let B= the outcome of “bop it” Find P(at least 1 B)
Ex 2: You’re playing a game where you roll 2 fair dice-one that is yellow, the other that is blue. • Imagine that you roll the dice once. List all possible outcomes in the Sample Space:
Ex 2: You’re playing a game where you roll 2 fair dice-one that is yellow, the other that is blue. • Let A = roll a sum of 4 • Find P (A) • c. Let B = roll a sum of 4 or less • Find P (B)
Ch. 7 Probability Rules Day 2
Question: You purchase a policy that charges only $50 a year. If it pays $10,000 for death and $5000 for a permanent disability, is the company likely to make a profit? Actuaries at for the company have determined the following probabilities in any given year: P (Death) = 1/1000 P (Permanently disabled) = 2/1000 P (Healthy) = ? Ex 1: Betting on Death!
Ex 1: Betting on Death! P (Death) = 1/1000 P (Permanently disabled) = 2/1000 P (Healthy) = ? • Make a probability model for this situation. • What is the probability that you will not be Permanently disabled?
Ex 1: Betting on Death! P (Death) = 1/1000 P (Permanently disabled) = 2/1000 P (Healthy) = ? c. What is the probability that you will die or be permanently disabled?
Ch. 7 Probability Rules Day 3 2 Way Tables
What is a two-way table? A two- way table organizes data, when we are measuring more than one variable.
Ex. 1: Angelo has a lot of family… Aunts Uncles Totals: Good 6 7 Bad 12 8 Ugly 3 11 Totals: *In this situation, the variables that are being measured are the number of aunts and uncles Angelo has and whether they are “good, bad, or ugly.”
Ex. 1: Angelo has a lot of family… Aunts Uncles Totals: Good 6 7 Bad 12 8 Ugly 3 11 Totals: a. What is the probability of randomly selecting one of Angelo’s relatives and having him or her be “ugly?”
Ex. 1: Angelo has a lot of family… Aunts Uncles Totals: Good 6 7 13 Bad 12 8 20 Ugly 3 11 14 Totals: 21 26 47 a. What is the probability of randomly selecting one of Angelo’s relatives and getting a Good Aunt?
Ex. 1: Angelo has a lot of family… Aunts Uncles Totals: Good 6 7 13 Bad 12 8 20 Ugly 3 11 14 Totals: 21 26 47 a. What is the probability of randomly selecting one of Angelo’s relatives and not getting an Aunt or someone who is bad?
Ch. 7 Probability Rules Day 4 Venn Diagrams
What is a Venn Diagram? A Venn Diagram neatly organizes data for variables with 2 outcomes.
Ex. 1: Poor Angelo… Looking at only to Good and the Bad ones… Aunts Uncles Totals: Good 6 7 13 Bad 12 8 20 Totals: 18 15 33 a. Make a Venn Diagram using A=aunt and G=she’s a Good Aunt.
Ex. 1: Poor Angelo… Using the Venn Diagram: b. Find the probability that you randomly select an Aunt who is Good. c. Find the probability that you randomly select a Bad Uncle.