Download
1 / 46
470 likes | 520 Vues
Learn to interpret ECG tracings, identify key components of the heart's electrical system, recognize abnormalities, diagnose conditions, and assess patients with chest pain. Understand ECG criteria for various dysrhythmias and blockages. Get fluent in ECG readings!

E N D
Learning Objectives After reading this chapter you will be able to: Describe the clinical value of the electrocardiogram (ECG) Describe the clinical findings that indicate the need for an ECG recording Identify key components of the electrical conduction system of the heart and the role of each component Define depolarization and repolarization
Learning Objectives (cont’d) Describe the specific electrical activity of the heart associated with each wave and interval of the normal ECG Identify the normal values for the PR interval and the QRS complex Identify the ventricular rate and position of the mean QRS vector from an ECG recording
Learning Objectives (cont’d) List the steps for ECG interpretation Describe ECG criteria for: Sinus bradycardia Sinus tachycardia Sinus dysrhythmia Premature atrial contraction Atrial flutter Atrial fibrillation Premature ventricular contractions Ventricular tachycardia Ventricular fibrillation Asystole First, second, and third-degree atrioventricular (AV) block
Learning Objectives (cont’d) Describe the ECG abnormalities associated with chronic lung disease Identify the signs of ischemia, injury, and infarction using the 12-lead ECG tracing Explain how to assess and help treat patients with chest pain
Introduction RTs observing the onset of an ischemic cardiac event may be the first link in the chain of survival Early recognition of a serious cardiac problem may minimize cardiac damage or prevent death
Introduction (cont’d) ECG reflects electrical activity of the heart 12-lead ECGs provide 12 different views of that activity Diagnostic tool to detect abnormalities such as: Myocardial infarctions Ventricular hypertrophy Dysrhythmias
When Should an ECG Be Obtained? Obtain an ECG when there are signs/symptoms of acute or chronic cardiac disorders CHF Angina Acute myocardial infarction Prior to surgery as a screening tool
Cardiac Anatomy and Physiology The heart is composed of 4 chambers 2 upper chambers: atria 2 lower chambers: ventricles Heart divided down the middle to form the right and left side Right atria and ventricle receive venous blood and circulate it to the lungs for gas exchange Left atria and ventricle receive oxygenated blood from lungs and circulate it to entire body
Cardiac Anatomy and Physiology (cont’d) Electrophysiology Electrical activity starts in the sinoatrial (SA) node because it has the greatest level of automaticity Signal travels throughout atria and via internodal pathways to atrioventricular (AV) node Signal delayed in AV node to allow atrial contraction prior to ventricular contraction Then travels through right and left bundle branches and to Purkinje fibers of the ventricles
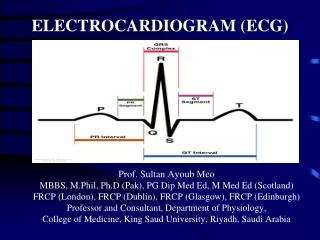
Basic ECG Waves Depolarization: sudden loss of negative charge in polarized cells when stimulated Repolarization: return of the negative charge within the cell ECG tracings record the waves of depolarization and repolarization traveling across the myocardium Each wave can be identified and analyzed
Basic ECG Waves (cont’d) P wave: atrial depolarization PR interval: time for impulse to travel to ventricles Normally 0.12 to 0.20 second Allows atrial contraction and “priming of the pump” to precede ventricular contraction
Basic ECG Waves (cont’d) QRS complex: ventricular depolarization Normally occurs in <0.12 second ST segment: between QRS and T wave T wave: ventricular repolarization
Basic ECG Waves (cont’d) Evaluating heart rate (HR) If HR regular, count number of large boxes (0.2 sec) between QRS complexes and divide this number into 300 300: number of large boxes occurring in 1 minute 1 box between QRS would be rate of 300 2 boxes between would be rate of 150 etc. If HR irregular, average obtained by counting QRS complexes in a 6-sec strip times 10
ECG Leads 12-lead ECG provides different views of same event 6 limb leads: I, II, III, aVR, aVL, aVF View heart on frontal plane used to determine axis 6 chest leads: V1, V2, V3, V4, V5, V6 View the heart on the horizontal plane Overlie the RV (V1, V2), ventricular septum (V3, V4) and LV (V5, V6 )
Evaluating the Mean QRS Axis The QRS axis reflects the general direction of electrical flow during depolarization Normally the axis points to the left and downward Between 0 and +90 degrees
Evaluating the Mean QRS Axis (cont’d) An upward deflection is seen on the ECG when the axis is flowing toward a positive electrode A downward deflection is made when the axis travels toward a negative electrode The axis points toward the lead with the tallest QRS
Evaluating the Mean QRS Axis (cont’d) If the tallest QRS complexes are equal in two leads the axis falls midway between the two leads. Figure 11-12 shows the degree at which each lead lies and thus it is easy to determine the axis If lead II had the tallest QRS, then the axis is at +60˚
Steps of ECG Interpretation First evaluate patient’s overall condition Clinical signs and symptoms may aid in identifying the dysrhythmia Interpretation can be done on three levels Ventricular response Origin of the impulse Electrophysiology Ectopic beats or rhythms, escape beats or rhythms AV blocks or bundle branch blocks
Steps of ECG Interpretation (cont’d) Use a systematic method: Identify the heart rate Evaluate the rhythm Note the presence of P waves Measure the PR interval Measure the width of the QRS complex Inspect the ST segment in all leads Identify the mean QRS axis Assess the waveform morphology Evaluate the Q wave Look for signs of chamber enlargement
Sinus Bradycardia Meets all the criteria for NSR but is too slow Rate: less than 60 beats/min Rhythm: regular P waves: normal and followed by a QRS complex PR interval: 0.12 to 0.2 second QRS: less than 0.12 second in width
Sinus Tachycardia Meets all criteria for NSR but is too fast Rate: 100 to 150 beats/min Rhythm: regular P waves: normal and followed by a QRS complex PR interval: 0.12 to 0.2 second QRS: less than 0.12 second in width
Sinus Dysrhythmia Meets all criteria for NSR but is irregular Rate: 60 to 100 beats/min; may also be bradycardia Rhythm: irregular P waves: normal and followed by a QRS complex PR interval: 0.12 to 0.2 second in length QRS: less than 0.12 second in width
Atrial Flutter Distinct rapid sawtooth pattern between normal QRS Rate: atrial rates 180 to 400; ventricular rate is slower Rhythm: regular P waves: sawtooth and uniform PRI: not measurable QRS: less than 0.12 second in width
Atrial Fibrillation Characterized by chaotic baseline between QRSs Rate: variable (count QRSs in 6-second strip) Rhythm: irregularly irregular P waves: fibrillatory waves that all vary PRI: not measurable QRS: less than 0.12 second in width
Premature Ventricular Contractions Underlying rhythm is interrupted by wide QRS (>0.12 s) not preceded by a P wave, with an inverted T Rate: that of the underlying rhythm Rhythm: regular rhythm is interrupted by PVC P waves: not associated with the PVC PR interval: not measurable QRS: >0.12 second, premature, abnormal configuration, followed by compensatory pause
Ventricular Tachycardia Wide QRSs occurring rapidly without P waves Rate: 140 to 300 beats/min Rhythm: regular P waves: not associated with the QRS complexes PR interval: not measurable QRS: abnormal and >0.12 second in width
Ventricular Fibrillation Chaotic, characterized by wavy irregular pattern Rate: none Rhythm: irregular, chaotic waves P waves: none PRI: none QRS: none or sporadic low-amplitude waves
Asystole Characterized by a straight or almost flat line Rate: none Rhythm: none P waves: none PRI: none QRS: none
AV Heart Block General term: problems conducting impulses from the atrial to the ventricles Blocks can occur at the AV node, bundle of His, or the bundle branches Complete heart block may be associated with hypotension Milder forms of heart block often cause no symptoms
First-Degree AV Block Looks like NSR but a prolonged PR interval (>0.2 sec) Rate: underlying rhythm rate Rhythm: regular P waves: normal each preceding a QRS complex PRI: >0.2 second QRS: < 0.12 second in width
Second-Degree AV Block Type I (Wenckebach) Recurrent lengthening PRI followed by a dropped QRS Rate: varies, ventricular rate less than atrial rate Rhythm: irregular P waves: normal not always followed by a QRS PR interval: varies, lengthens, then none conducted QRS: < 0.12 second in width
Second-Degree AV Block Type II (Wenckebach) (cont’d) Characterized by nonconducted P waves followed by a P wave that is conducted thus has an associated QRS Rate: varies, ventricular rate less than atrial rate Rhythm: atrial rate is regular, ventricular rate may be regular or irregular P waves: normal not always followed by a QRS PR interval: normal or prolonged but constant QRS: < 0.12 second in width
Third-Degree AV Block (Complete Heart Block) No association between P waves and QRS complexes Rate: slow, ventricular rate less than atrial rate Rhythm: atrial and ventricular rates are regular P waves: normal not always followed by a QRS PRI: varies, no relationship to QRS complexes QRS: generally but not always >0.12 second
Evidence of Cardiac Ischemia, Injury, or Infarction Cardiac ischemia Indicated by depressed ST segment (≥1 mm below baseline) or inversion of the T waves Injury is potentially reversible at this point
Evidence of Cardiac Ischemia, Injury, or Infarction (cont’d) Acute myocardial injury Noted by elevated ST segment changes over the affected myocardium Generally indicates acute myocardial infarction ST segment returns to baseline with restored perfusion
Evidence of Cardiac Ischemia, Injury, or Infarction (cont’d) Myocardial infarction Noted early by elevated ST segments and T wave changes Once fully evolved pathologic Q waves appear Appear hours to days following AMI Generally remain for the duration of patient’s life
Assessing Chest Pain Assess S/S by asking the patient: O: onset of pain P: provoked by … Q: quality of pain R: radiation of pain to … S: severity of pain between 0 and 10 T: time frame of symptoms (acute or chronic) U: what do You perceive as wrong? AHA says suspect AMI if nonresponsive to nitroglycerin
ECG Patterns with Chronic Lung Disease Multiple ECG changes with severe COPD Right axis deviation is common P waves larger due to right atrial enlargement Leads II, III, and aVF Prominent and negative P wave in lead I May have changes associated with cor pulmonale Increase R-wave size on leads V1, V2, and V3 Reduced size of QRS in leads I, II, III, V5, and V6
Summary An ECG provides a picture of heart’s electrical activity ECG can identify the condition of the heart’s electrical conduction system The ECG can also identify abnormal rhythms that may be of little consequence or very serious and life threatening ECG does not measure pumping ability of the heart