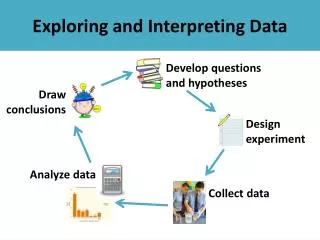
Interpreting data for program evaluation and planning
This guide provides strategies for interpreting data to evaluate and refine literacy programs. It focuses on regrouping students, choosing instructional emphasis, and assigning interventions based on student needs.

Interpreting data for program evaluation and planning
E N D
Presentation Transcript
Literacy Coach’s Focus In Data Analysis First Priority Second Priority Regrouping Program Evaluation To what extent is my program keeping Benchmark children at benchmark? Form needs-based groups for classroom instruction To what extent is small-group work moving strategic children to benchmark? Choose instructional emphasis To what extent is my program moving Intensive children to benchmark? Assign children to interventions To what extent are classroom effects apparent?
Literacy Coach’s Focus In Data Analysis First Priority Regrouping Form needs-based groups for classroom instruction Which DIBELS reports should I use? Choose instructional emphasis Do you have curriculum materials to accomplish this? Assign children to interventions
Literacy Coach’s Focus In Data Analysis Second Priority Program Evaluation To what extent is my program keeping Benchmark children at benchmark? To what extent is small-group work moving strategic children to benchmark? To what extent is my program moving Intensive children to benchmark? To what extent are classroom effects apparent?
General Impressions • We are increasingly successful in prevention-based instruction in Kindergarten • We need to continue to experiment in intervention, particularly for second and third grade Consider time, focus, and explicitness for needs-based work? Consider additional intervention programs?
Cross-Sectional Analysis How well are the kindergarten children this year doing compared to last year? • Did they start out stronger or weaker? • Did they make more or less progress between fall and winter? And yes, these are different children, but the teachers are the same and the program is the same
For Kindergarten Beginning of kindergarten status includes weighted combinations of measures Middle kindergarten directs attention to initial sound fluency End of kindergarten directs attention to phoneme segmentation fluency *You have to look at your own data, considering all measures, to really evaluate your program
New Directions What did you decide to do differently next year when you saw these data for your school?
For first grade Beginning of first grade status includes weighted combinations of measures Middle first grade directs attention to nonsense word fluency End of first grade directs attention to oral reading fluency *You have to look at your own data, considering all measures, to really evaluate your program
New Directions What did you decide to do differently next year when you saw these data for your school?
For Second Grade Beginning of second grade status includes weighted combinations of measures Middle second grade directs attention to oral reading fluency End of second grade directs attention to oral reading fluency *You have to use the cognitive model of assessment to interpret these data
New Directions What did you decide to do differently next year when you saw these data for your school?
For Third Grade Third grade data include only oral reading fluency *You have to use the cognitive model of assessment to interpret these data
New Directions What did you decide to do differently next year when you saw these data for your school?
Cohort Analysis Given children’s experience at your school over time, to what extent is your instructional program actually accelerating literacy growth over time? (and you are right when you say it’s not EXACTLY the same children if your population is highly transient)
Interpretation • To what extent have you set and communicated the plan? • To what extent are teachers understanding and implementing the curriculum? • How are they using time? • How are they monitoring progress and adjusting their instruction and groupings? • How well are they using intervention options?
If you’re not getting the results you want, you have to do something different. Start with yourself Work more closely with administration. Spend more time in classrooms. Focus your pd time on differentiation.
Next Steps • Reflect on your own data; check on individual indicators in K and 1 to see if there are particular areas that are troublesome • Find your most and least successful classrooms and observe so that you can learn about the curriculum and you can evaluate the effectiveness of your own professional support system • Try something different