Non-linear regression
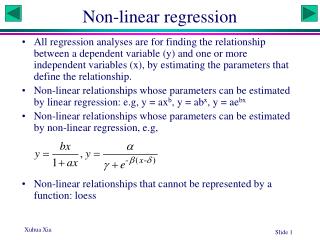
Non-linear regression. All regression analyses are for finding the relationship between a dependent variable (y) and one or more independent variables (x), by estimating the parameters that define the relationship.

Non-linear regression
E N D
Presentation Transcript
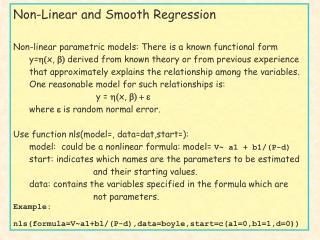
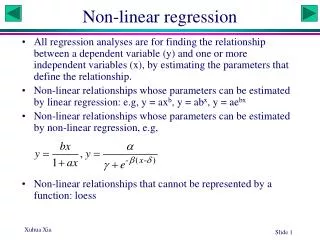
Non-linear regression • All regression analyses are for finding the relationship between a dependent variable (y) and one or more independent variables (x), by estimating the parameters that define the relationship. • Non-linear relationships whose parameters can be estimated by linear regression: e.g, y = axb, y = abx, y = aebx • Non-linear relationships whose parameters can be estimated by non-linear regression, e.g, • Non-linear relationships that cannot be represented by a function: loess
Growth curve of E. coli • A researcher wishes to estimate the growth curve of E. coli. He put a very small number of E. coli cells into a large flask with rich growth medium, and take samples every half an hour to estimate the density (n/L). • 14 data points over 7 hours were obtained. • What is the instantaneous rate of growth (r). What is the initial density (N0)? • As the flask is very large, he assumed that the growth should be exponential, i.e., y = a·ebx (Which parameter correspond to r and which to N0?) • Three approaches • Log-Transform to linear relationship • Direct least-square solution (EXCEL solver) • Direct least-absolute-difference solution (EXCEL solver)
Scatter plot In EXCEL: Log-transform DRun linear regressionObtain D0 and r
EXCEL solver Get initial value for r: Initial value for D0 is obtained with t = 0
Body weight of wild elephant • A researcher wishes to estimate the body weight of wild elephants. • He measured the body weight of 13 captured elephants of different sizes as well as a number of predictor variables, such as leg length, trunk length, etc. Through stepwise regression, he found that the inter-leg distance (shown in figiure) is the best predictor of body weight. • He learned from his former biology professor that the allometric law governing the body weight (W) and the length of a body part (L) states thatW = aLb • Use the three approaches to fit the equation
Scatter plot W = aLbIn EXCEL: Log-transform W and LRun linear regressionObtain a and b
EXCEL solver W=aLb Initial values:
DNA and protein gel electrophoresis • How to estimate the molecular mass of a protein? • A ladder: proteins with known molecular mass • Deriving a calibration curve relating molecular mass (M) to migration distance (D): D = F(M) • Measure D and obtain M • The calibration curve is obtained by fitting a regression model
Protein molecular mass • The equation D=aebM appears to describe the relationship between D and M quite well. This relationship is better than some published relationships, e.g., D = a – b ln(M) • The data are my measurement of D and M for a subset of secreted proteins from the gastric pathogen Helicobacter pylori (Bumann et al., 2002). • Homework: use the data and the three approaches to estimate parameters a and b (You don’t need to submit) Bumann, D., Aksu, S., Wendland, M., Janek, K., Zimny-Arndt, U., Sabarth, N., Meyer, T.F., and Jungblut, P.R., 2002, Proteome analysis of secreted proteins of the gastric pathogen Helicobacter pylori. Infect. Immun. 70: 3396-3403.
Area and Radius What is the functional relationship between the area and the radius? Homework (you do not need to submit): Measure the area A (by counting the squares) and radius r for each circle and estimate the parameters c and d in the equation A = crd by using the three approaches.
Toxicity study: pesticide What transformation to use?
Probit and probit transformation • Probit has two names/definitions, both associated with standard normal distribution: • the inverse cumulative distribution function (CDF) • quantile function • CDF is denoted by (z), which is a continuous, monotone increasing sigmoid function in the range of (0,1), e.g.,(z) = p(-1.96) = 0.025 = 1 - (1.96) • The probit function gives the 'inverse' computation, formally denoted -1(p), i.e.,probit(p) = -1(p) probit(0.025) = -1.96 = -probit(0.975) • [probit(p)] = p, and probit[(z)] = z.
Non-linear regression • In rapidly replicating unicellular eukaryotes such as the yeast, highly expressed intron-containing genes requires more efficient splicing sites than lowly expressed genes. • Natural selection will operate on the mutations at the slicing sites to optimize splicing efficiency. • Designate splicing efficiency as SE and gene expression as GE. • Certain biochemical reasoning suggests that SE and GE will follow the following relationships:
Scatter plot Initial values: 0.4 (inferred when GE = 0)/ 1 or (inferred when GE is very large)When GE = 8, we have (0.4+8 )/(1+8 ) = 0.78