Download
1 / 37
370 likes | 399 Vues
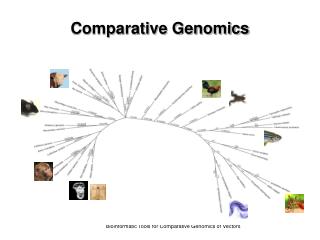
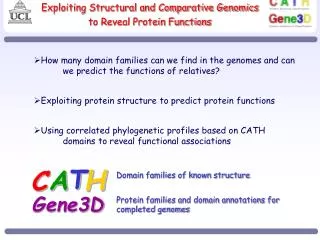
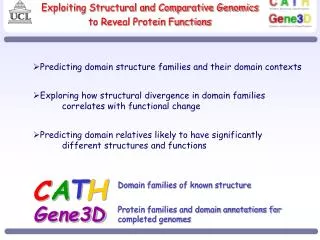
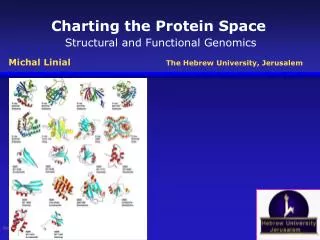
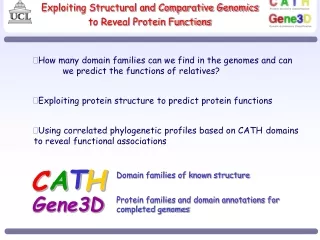
Exploiting Structural and Comparative Genomics to Reveal Protein Functions. How many domain families can we find in the genomes and can we predict the functions of relatives? Exploiting protein structure to predict protein functions

E N D
Exploiting Structural and Comparative Genomics to Reveal Protein Functions • How many domain families can we find in the genomes and can we predict the functions of relatives? • Exploiting protein structure to predict protein functions • Using correlated phylogenetic profiles based on CATH domains to reveal functional associations T H A C Domain families of known structure Gene3D Protein families and domain annotations for completed genomes
CATHEDRAL Oliver Redfern and Andrew Harrison Combines a rapid graph theory secondary structure filter with dynamic programming for accurate residue alignment SVM is used to combine scores and assess significance of match CATH version 3.0 1100 fold groups 2100 homologous superfamilies 86,000 Domains
DDP Fold Recognition Performance % Correct Fold SSAP Rank
Gene3D:Domain annotations in genome sequences scan against library of HMM models ~2000 CATH ~9000 Pfam >2 million protein sequences from 300 completed genomes and Uniprot assign domains to CATH and Pfam superfamilies Benchmarking by structural data shows that 76% of remote homologues can be identified using the HMMs
DomainFinder: structural domains from CATH take precedent NewFam Pfam-1 CATH-1 Pfam-2 Gene3D: Domain annotations in genome sequences N C CATH-1 Pfam-2 Pfam-1 NewFam
Domain families ranked by size (number of domain sequences) NewFam of unknown stucture Pfam families of unknown structure Percentage of all domain family sequences CATH superfamilies of known structure Rank by family size ~90% of domain sequences in the genomes and UniProt can be assigned to ~7000 domain families
<100 families account for 50% of domain sequences of known fold structural superfamily (CATH) F2 subfamily of relatives F3 F1 relatives likely to have similar functions F4 F5 Only ~3% of diverse sequences in large CATH domain families have known structures
Gene3D: Domain mappings for 300 Completed Genomes • 300 genomes, >2 million sequences including UniProt and RefSeq • structural domain assignments from CATH • functional domain assignments from Pfam • Also: SWISS-PROT, EC, COGs, GO, KEGG, MIPS, BIND, IntAct Iterative Profile SearchMethodology http://www.biochem.ucl.ac.uk:8080/Gene3D Russell Marsden, Corin Yeats, Michael Maibaum, David Lee Nucleic Acids Res. 2006 Yeats et al. Nucleic Acids res. 2006.
NewFam NewFam Pfam-1 Pfam-1 CATH-1 CATH-1 Pfam-2 Pfam-2 Conservation of enzyme function in homologous domains with same multidomain architecture (MDA) in Gene3D Protein 1 Protein 2 Conservation of EC number to 3 levels (%) Sequence identity
Sequence identity thresholds for 95% conservation of enzyme function (to 3 EC Levels) 332 highly conserved families 60 highly variable families number of families number of sequences Sequence identity thresholds number of sequences number of families
Exploiting Structural and Comparative Genomics to Reveal Protein Functions • How many domain families can we find in the genomes and can we predict the functions of relatives? • Exploiting protein structure to predict protein functions • Using correlated phylogenetic profiles based on CATH domains to reveal functional associations T H A C Domain families of known structure Gene3D Protein families and domain annotations for completed genomes
Conservation of Enzyme Function in CATH Domain Families Structural similarity (SSAP) score Pairwise sequence identity different functions same functions
Correlation of structural variability with number of different functional groups Number of COG functional groups Number of diverse structural clusters within family
Some families show great structural diversity Gabrielle Reeves Multiple structural alignment by CORA allows identification of consensus secondary structure and embellishments 2DSEC algorithm In 117 superfamilies relatives expanded by >2 fold or more These families represent more than half the genome sequences of known fold
Structural embellishments can modify the active site Galectin binding superfamily
Structural embellishments can modulate domain interactions side orientation face orientation Glucose 6-phosphate dehydrogenase a Dihydrodipiccolinate reductase Additional secondary structure shown at (a) are involved in subunit interactions
Structural embellishments can modify function by modifying active site geometry and mediating new domain and subunit interactions Biotin carboxylase D-alanine-d-alanine ligase ATP Grasp superfamily Dimer of biotin carboxylase
80 60 Frequency (%) 40 Indel frequency < 1 % 20 0.85% 0.38% 0.23% 0.11% 0.06% 0.02% 0 1 2 3 4 5 6 7 8 9 10 11 12 Size of Indel (number of secondary structures) Secondary structure insertions are distributed along the chain but aggregate in 3D 85% of residue insertions comprise only 1 or 2 secondary structures 60% of domains have secondary structure embellishments co-located in 3D with 3 or more other embellishments In 80% of domains, 1 or more embellishments contact other domains or subunits
~80% of variable families are adopt regular layered architectures 2 Layer Alpha Beta Sandwich 2 Layer Beta Sandwich 3 Layer Alpha Beta Sandwich Alpha / Beta Barrel
2 Layer Alpha Beta Sandwich 2 Layer Beta Sandwich 3 Layer Alpha Beta Sandwich Alpha / Beta Barrel
Function prediction to Guide Target Selection for Structural Genomics structural superfamily (CATH) close relatives with same MDA F2 F3 F1 relatives likely to have similar functions F4 F5 Only ~3% of diverse sequence families (S30 clusters) in large CATH families have known structures
Conservation of Enzyme Function in Homologous Domains Conservation of EC levels (%) Structure similarity (SSAP) score
FLORA – structural templates for assigning structures to functional subgroups in CATH Perform CORA multiple structural alignment on functional subfamiles within CATH superfamily Use CORAXplode (HMMs) to find related sequences in UniProt and identify conserved residues (seed) Explore local structural environment of seed residues to find conserved structural motifs Dataset of 84 enzyme superfamilies in CATH of which 21 are functionally very diverse
Finding conserved residue positions (seeds) - Scorecons multiple sequence alignment of relatives from functional family guided by structure alignment identify most highly conserved residue positions using Scorecons – Valdar and Thornton (2001) seed positions
FLORA Algorithm for Identifying Structural Homologues with Similar Functions expand to local environment of 12Å assign conserved sequence seeds identify structurally conserved residue cliques and generate template new structures are scanned against a library of FLORA templates and SVMs used to assess significance of matches
Performance of FLORA vs Global Structure Comparison (SSAP) Coverage Error rate
Exploiting Structural and Comparative Genomics to Reveal Protein Functions • How many domain families can we find in the genomes and can we predict the functions of relatives? • Exploiting protein structure to predict protein functions • Using correlated phylogenetic profiles based on CATH domains to reveal functional associations T H A C Domain families of known structure Gene3D Protein families and domain annotations for completed genomes
CATH Domain Superfamily Organism sp1 sp2 sp3 sp4 12 13 14 11 Superfamily 1 35 0 12 60 Superfamily 2 6 0 0 0 Superfamily 3 Eisenberg Phylogenetic Profiles for Detecting Functional Associations Superfamily Organism sp1 sp2 sp3 sp4 presence or absence of superfamily in organism Functionally Linked 1 0 1 0 Superfamily 1 1 0 1 0 Superfamily 2 0 0 1 1 Superfamily 3 Gene3D Phylogenetic Occurrence Profiles number of relatives from superfamily in organism
Phylogenetic Occurrence Profiles Based on Domain Superfamily and Subfamilies in Gene3D 50% sequence identity cluster Superfamily 40% sequence identity cluster 30% sequence identity cluster
Sp1 Sp2 Sp3 Sp4 … Spn 3 3 5 7 … 5 0 2 4 5 … 4 1 0 1 0 … 1 0 2 0 0 … 6 1 0 2 1 … 0 0 3 1 2 … 1 0 0 0 1 … 2 . . . . … . . . . . … . . . . . … . 0 1 0 1 … 0 Cluster 1 Cluster 2 Cluster 3 Cluster 4 Cluster 5 Cluster 6 Cluster 7 . . . Cluster n Phylogenetic Profiles for Families and Subfamilies Juan Ranea and Corin Yeats domains clustered at different levels of sequence similarity: phylogenetic occurrence profile matrix Superfam. 30% 40% 50% 60%… 100%
10 5 Sp1 Sp2 Sp3 Sp4 Sp5 … Spn Sp1 Sp2 Sp3 Sp4 Sp5 … Spn 10 6 9 6 9 5 … 9 4 3 7 5 3 … 5 1 0 1 0 2 … 1 0 2 0 0 1 … 6 1 4 1 4 1 … 4 0 3 1 2 0 … 1 4 8 4 8 4 … 8 . . . . . … . . . . . . … . . . . . . … . 0 1 0 1 1 … 0 Cluster 1 Cluster 2 Cluster 3 Cluster 4 Cluster 5 Cluster 6 Cluster 7 . . . Cluster n 5 Sp1 Sp2 Sp3 Sp4 Sp5 … Spn 10 5 Sp1 Sp2 Sp3 Sp4 Sp5 … Spn Comparison of Pairs of Phylogenetic Profiles Cluster 1 Cluster 2 Cluster 1 E1 Cluster 5 E2 Euclidian distance: Cluster 1 E1 >>E2 Cluster 7
Statistical Significance of Correlated Pairs (Comparison against 3 randomised models) Real matrix Random matrix I Frequency Random matrix II Random matrix III Pearson correlation coefficients
Domain Associations Network from 13 Eukaryotes: Actin & VCP-like ATPases DNA replication and repair Chaperones and Cytoskeleton DNA Topoisomerase & Elongation factor G
DNA topoisomerase & Elongation Factor G Number of domain relatives Species
Highly correlated profiles correspond to pairs of families with significant similarity in GO functions biological processes Distances of correlated profile scores Frequency of significant GO semantic similarity scores
Summary • On average 85% of domain sequences in genomes can be assigned to ~6000 domain families in CATH and Pfam • Information on multidomain architectures (MDAs) can extend functional annotations obtained through domain based homologies • Specific structural templates for functional subgroups within domain families can also help in assigning functions as more structures are solved • Analysis of Gene3D phylogenetic occurrence profiles allows detection of functional associations between families
Acknowledgements Gene3D CATH Lesley Greene Alison Cuff Ian Sillitoe Tony Lewis Mark Dibley Oliver Redfern Tim Dallman Corin Yeats Sarah Addou Russell Marsden David Lee Alastair Grant Ilhem Diboun Juan Garcia Ranea http://www.biochem.ucl.ac.uk/bsm/cath_new Medical Research Council, Wellcome Trust, NIH EU funded Biosapiens, EU funded Embrace, BBSRC