Download
1 / 2
20 likes | 113 Vues
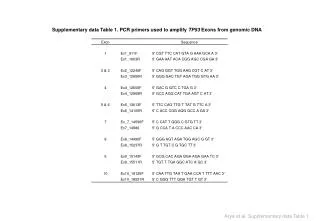
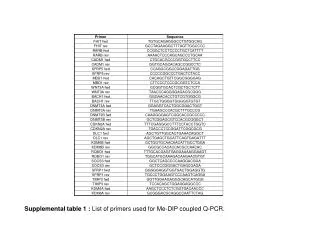
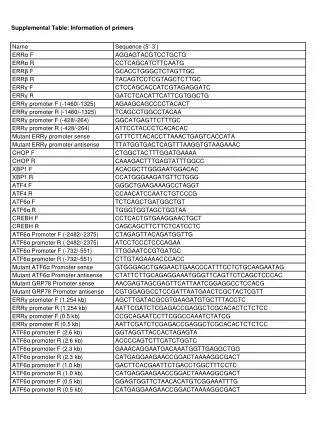
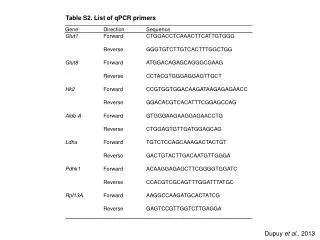
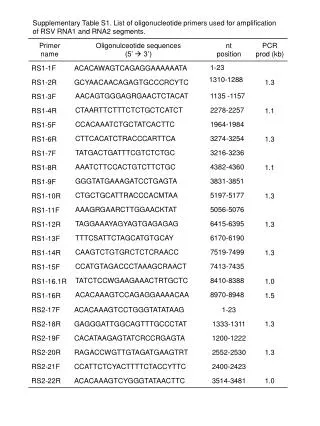
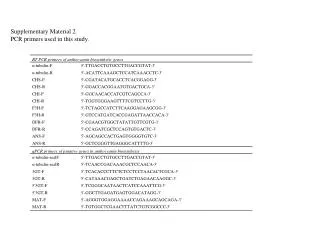
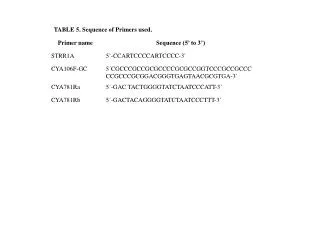
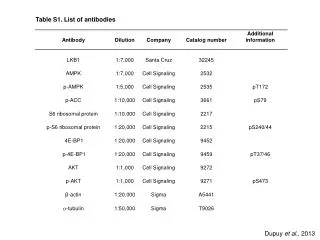
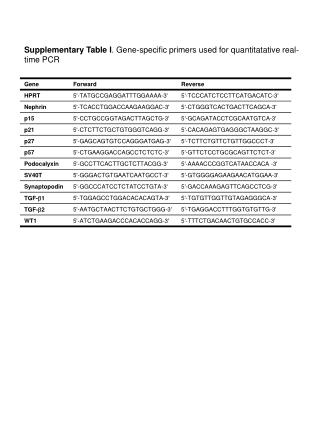
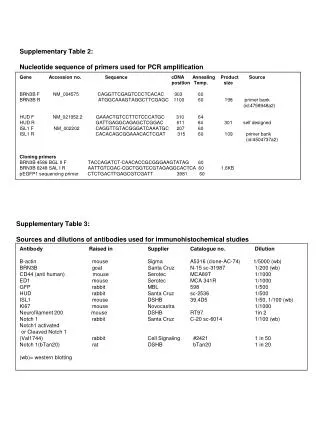
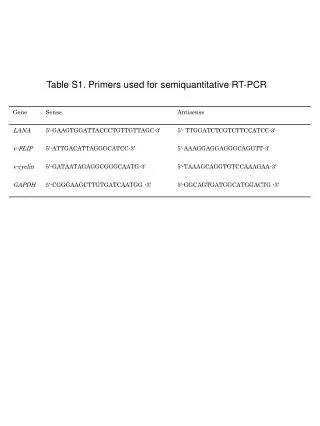
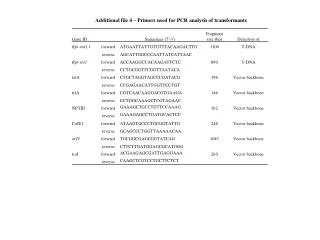
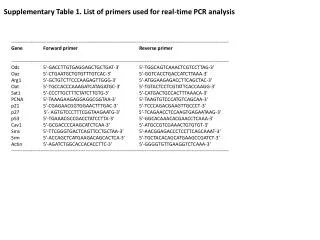
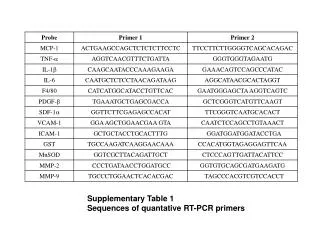
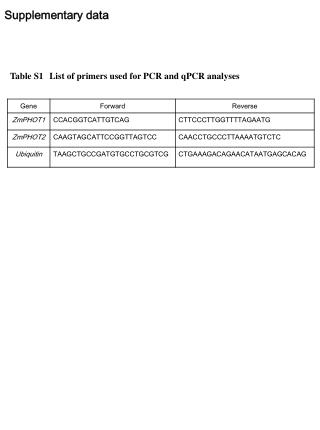
Supplementary data table presenting a comprehensive list of primers used for PCR and qPCR analyses on the coleoptile region from the top, with molecular marker results shown in Figures 5c, 6a, and 6c. Detailed information on primer sequences and marker sizes provided.

E N D
Supplementary data Table S1List of primers used for PCR and qPCRanalyses
Fig S1 No LBL HBL 1 510 1 5 10 (min) Coleoptile region from the top a (Fig.5c) Molecular marker (kDa) 0-3 3-6 6-9 (mm) 180 130 100 75 b (Fig.6a) Molecular marker (kDa) No LBL HBL Molecular marker (kDa) c (Fig.6c) ShIrShIrShIr 180 180 130 130 100 100 Fig S1. CBB stained PVDF membranes after Western analysis shown in Fig. 5 and Fig 6. a. Corresponding to Fig. 5c. b. Corresponding to Fig. 6a. c. Corresponding to Fig. 6c. 75