Download
1 / 15
150 likes | 168 Vues
This article discusses the hydrologic theory and the response of watersheds to rainfall, including the factors affecting runoff, the calculation of effective precipitation, and the use of unit hydrographs. It also covers the quantification of the hydrologic cycle and methods for determining rainfall averages.

E N D
Hydrologic Theory • One of the principal objectives in hydrology is to transform rainfall that has fallen over a watershed area into flows to be expected in the receiving stream. • Losses must be considered such as infiltration or evaporation (long-term) • Watershed characteristics are important
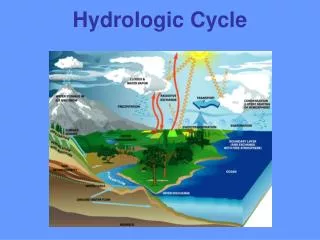
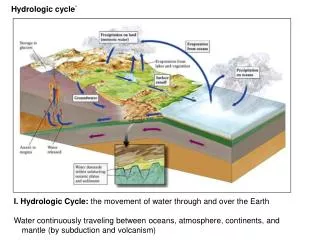
The Watershed Response • As rain falls over a watershed area, a certain portion will infiltrate the soil. Some water will evaporate back. • Rainfall that does not infiltrate or evaporate is available as overland flow and runs off to the nearest stream. • Smaller tributaries or streams then begin to flow and contribute their load to the main channel at confluences. • As accumulation continues, the streamflow rises to a maximum (peak flow) and a flood wave moves downstream through the main channel. • The flow eventually recedes or subsides as all areas drain out. • The portion of the rainfall that does not contribute to direct surface runoff is termed Rainfall Abstractions (intercepted by vegetation, infiltrated into the ground surface, retained in depression as puddles or returned to the atmosphere through transpiration and evaporation. • The portion that contributes to surface runoff is called Effective Precipitation.
Causes of Precipitation Precipitation lifting mechanisms Orographic: wind-induced mechanical process of lifting over mountain ranges Convective: thermodynamic process of heating at or near surface – summer, large cities and tropic Cyclonic: Frontal systems and buoyancy effects - winter
Determination of Runoff Volume Case I: (for Dp > Dli and Dr > Ds) Dr = Dp – Dli – Di – Ds – De Case II: (for Dp≤ Dli and Dr ≤ Ds) Dr = 0 Where: Dr = total depth of runoff (effective precipitation) Dp = total depth of precipitation (rainfall) Dli = total initial loss (interception) Di = total depth infiltrated after initial losses Ds = total depression storage depth De = transpiration and evaporation losses (often ignored for short-duration stormwater events) Volume of runoff (Vr) or effective precipitation Vr = Dr x A
Unit Hydrograph Theory • The unit hydrograph represents the basin response to 1 inch (1 cm) of uniform net rainfall for a specified duration. • A graphical representation of discharge over time and provides peak flow rate • Linear method (principles of linearity and superposition apply) • Works best for relatively small subareas - in the range of 1 to 10 sq miles. • Several computational methods exist and most widely used for surface runoff. • Could be measured (for gaged watershed) or computed (synthesized)
Inst. Hydrograph Response • Rainfall falls over the basin • Intensity I reaches the outlet - response based on travel time • Produces a total storm response hydrograph as shown • Little delay and no storage • The above only occurs in small urban basins or parking lots Ii Small Basin Qi = Ii A
Unit Hydrograph (UH) Method • Linear transform method • Converts complex rainfall to streamflow at outlet • Produces a total storm hydrograph from given UH • Used in complex watersheds • Each subarea is uniform • Storage effects considered Pi Uj Q T
Hydrograph - Watershed Flow Response to Rainfall • Peak Flow and time to peak relate to area/shape of watershed • Area under curve is the volume of direct RO • Time Base is time that flow exceeds baseflow • Time to peak or Lag is measured from center of mass of rainfall pattern Lag or time to peak Peak Flow Hydrograph RF Outflow Volume of Runoff Direct RO Time Base Time
Hydrograph Relations Net Rainfall (effective precipitation) Rising Limb Crest Falling Limb Recession Base Flow Direct Runoff DRO
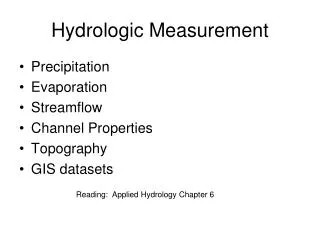
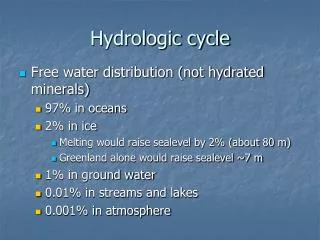
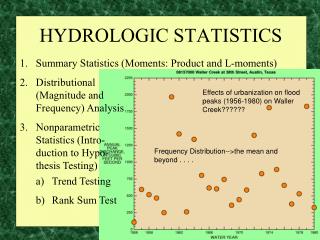
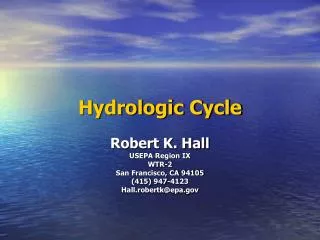
Hydrologic Budget Quantifying components of the hydrologic cycle. Precipitation and surface runoff phases are of greatest interest in hydraulic design (also, easiest to estimate) Sources of hydrologic data: National Oceanic and Atmospheric Administration (NOAA): Environmental Data (Climatological) National Weather Service (NWS) (Rainfall depths, rainfall intensities) The US Geological Survey (USGS) (Stream gages – flowrate cfs) The U.S. Army Corps of Engineers (lake evaporation, inches)
Rainfall Averaging Methods • Arithmetic • Thiessen Polygon • Divide area into polygons; Method: • draw lines between each gage • construct perpendicular bisector for each line • extend bisectors to form polygons • Isohyetal Contours • lines of equal precipitation. • Multiply average precipitation by area of subarea • Sum for all subareas • Divide by total area
Uses of precipitation Data Engineering • design of flood control structures: design to contain extreme flows (Maximum amount of predicted rainfall) • design of bridges, culverts, storm drains, other structures: design for large, but not extremely large flows • Design of large scale water storage and water supply systems (Minimum amount of predicted rainfall) • Water resource management • examine consistency of precipitation
Typical Streamflow Gage High Flow
Stream Cross-Section for Q • Measure V (anemometer) at 0.2 and 0.8 of depth • Average V and multiply by (width * depth) • Sum up across stream to get total Q = S (Vi Di Wi)