Download

1 / 14
140 likes | 253 Vues
This reading covers sections 13-1 and 13-2 of Applied Hydrology focusing on hydrologic design, water control, peak flows, erosion, pollution, and water management. Tasks include determining design inflow, routing it, finding the output, and ensuring safety and cost-effectiveness. Design scale, considerations, estimated limiting values, probable maximum precipitation, TxDOT recommendations, and hydroeconomic analysis are discussed, along with risk analysis and hydrological uncertainty. Examples and calculations illustrate concepts like probabilistic methods and assessing design return period for structures.

E N D
Hydrologic Design Reading: Applied Hydrology Sections 13-1, 13-2
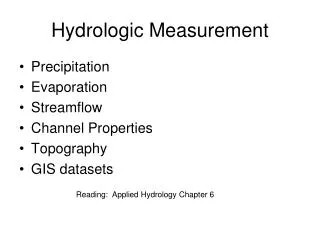
Hydrologic design • Water control • Peak flows, erosion, pollution, etc. • Water management • Domestic and industrial use, irrigation, instream flows, etc • Tasks • Determine design inflow • Route the design inflow • Find the output • check if it is sufficient to meet the demands (for management) • Check if the outflow is at safe level (for control)
Hydrologic design scale • Hydrologic design scale – range in magnitude of the design variable within which a value must be selected • Design considerations • Safety • Cost • Do not design small structures for large peak values (not cost effective) • Do not design large structures for small peak values (unsafe) • Balance between safety and cost.
Estimated Limiting Value (ELV) • Lower limit on design value – 0 • Upper limit on design value – ELV • ELV – largest magnitude possible for a hydrologic event at a given location, based on the best available hydrologic information. • Length of record • Reliability of information • Accuracy of analysis • Probable Maximum Precipitation (PMP) / Probable Maximum Flood (PMF)
Probable Maximum Precipitation Most recent report 1999 http://www.nws.noaa.gov/oh/hdsc/studies/pmp.html
Hydrologic design level • Hydrologic design level – magnitude of the hydrologic event to be considered for the design or a structure or project. • Three approaches for determining design level • Empirical/probabilistic • Risk analysis • Hydroeconomic analysis
Empirical/Probabilitic • P(most extreme event of last N years will be exceeded once in next n years) • P(largest flood of last N years will be exceeded in n=N years) = 0.5 • Drought lasting m years is worst in N year record. What is the probability that a worse drought will occur in next n years? • # sequences of length m in N years = N-m+1 • # sequences of length m in n years = n-m+1
Example 13.2.1 • If the critical drought of the record, as determined from 40 yrs of data, lasted 5 yrs, what is the chance that a more severe drought will occur during the next 20 yrs? • Solution: N = 40, m = 5 and n = 20
Risk Analysis • Uncertainty in hydrology • Inherent - stochastic nature of hydrologic phenomena • Model – approximations in equations • Parameter – estimation of coefficients in equations • Consideration of Risk • Structure may fail if event exceeds T–year design magnitude • R = P(event occurs at least once in n years) • Natural inherent risk of failure
Example 13.2.2 • Expected life of culvert = 10 yrs • Acceptable risk of 10 % for the culvert capacity • Find the design return period • What is the chance that the culvert designed for an event of 95 yr return period will have its capacity exceeded at least once in 50 yrs? The chance that the capacity will not be exceeded during the next 50 yrs is 1-0.41 = 0.59
Hydroeconomic Analysis • Probability distribution of hydrologic event and damage associated with its occurrence are known • As the design period increases, capital cost increases, but the cost associated with expected damages decreases. • In hydroeconomic analysis, find return period that has minimum total (capital + damage) cost.