Hydrologic Design and Design Storms
320 likes | 541 Vues
Hydrologic Design and Design Storms. Venkatesh Merwade, School of Civil Engineering, Purdue University. Some slides are taken from Dr. David Maidment, University of Texas at Austin. Hydrologic Cycle. Rainfall Hyetograph. www.mem.odu.edu. Rainfall Hyetograph and Mass Curve.

Hydrologic Design and Design Storms
E N D
Presentation Transcript
Hydrologic Design and Design Storms Venkatesh Merwade, School of Civil Engineering, Purdue University Some slides are taken from Dr. David Maidment, University of Texas at Austin
Rainfall Hyetograph www.mem.odu.edu
Rainfall hyetograph creates a discharge hydrograph at the receiving detention pond or stream or storm water treatment facility
Hydrologic design • Water control • Peak flows, erosion, pollution, etc. • Water management • Domestic and industrial use, irrigation, instream flows, etc • Tasks • Determine design inflow • Route the design inflow • Find the output • check if it is sufficient to meet the demands (for management) • Check if the outflow is at safe level (for control)
Frequency and Recurrence Interval • Small storm versus big storm • Recurrence Interval: number of years of data divided by the number of occurrences
Return Period (T) • Average recurrence interval over an extended period of time • Probability of occurrence = 1/T • 100 year flow (Q100) will have a 1% chance of occurrence every year
Design Storms • Get Depth, Duration, Frequency Data for the required location • Select a return period • Convert Depth-Duration data to a design hyetograph.
Depth (intensity)-duration-frequency • DDF/IDF – graph of depth (intensity) versus duration for different frequencies • TP 40 or HYDRO 35 gives spatial distribution of rainfall depths for a given duration and frequency • DDF/IDF curve gives depths for different durations and frequencies at a particular location • TP 40 or HYDRO 35 can be used to develop DDF/IDF curves • Depth (P) = intensity (i) x duration (Td)
TP 40 • Hershfield (1961) developed isohyetal maps of design rainfall and published in TP 40. • TP 40 – U. S. Weather Bureau technical paper no. 40. Also called precipitation frequency atlas maps or precipitation atlas of the United States. • 30mins to 24hr maps for T = 1 to 100 • Web resources for TP 40 and rainfall frequency maps • http://www.tucson.ars.ag.gov/agwa/rainfall_frequency.html • http://www.erh.noaa.gov/er/hq/Tp40s.htm • http://hdsc.nws.noaa.gov/hdsc/pfds/
2yr-60min precipitation map This map is from HYDRO 35 (another publication from NWS) which supersedes TP 40
Equations for IDF curves IDF curves can also be expressed as equations to avoid reading from graphs i is precipitation intensity, Td is the duration, and c, e, f are coefficients that vary for locations and different return periods This equation includes return period (T) and has an extra coefficient (m)
IDF curves for Austin Source: City of Austin, Watershed Management Division
Design Precipitation Hyetographs • Most often hydrologists are interested in precipitation hyetographs and not just the peak estimates. • Techniques for developing design precipitation hyetographs • SCS method • Triangular hyetograph method • Using IDF relationships (Alternating block method)
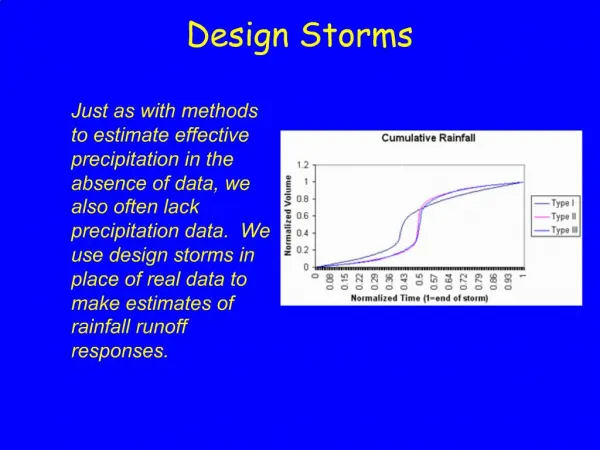
SCS Method • SCS (1973) adopted method similar to DDF to develop dimensionless rainfall temporal patterns called type curves for four different regions in the US. • SCS type curves are in the form of percentage mass (cumulative) curves based on 24-hr rainfall of the desired frequency. • If a single precipitation depth of desired frequency is known, the SCS type curve is rescaled (multiplied by the known number) to get the time distribution. • For durations less than 24 hr, the steepest part of the type curve for required duraction is used
SCS Method Steps • Given Td and frequency/T, find the design hyetograph • Compute P/i (from DDF/IDF curves or equations) • Pick a SCS type curve based on the location • If Td = 24 hour, multiply (rescale) the type curve with P to get the design mass curve • If Td is less than 24 hr, pick the steepest part of the type curve for rescaling • Get the incremental precipitation from the rescaled mass curve to develop the design hyetograph
Indiana Resources http://www.in.gov/dnr/water/4897.htm