Download
1 / 12
130 likes | 268 Vues
Dive into the world of discrete probability distributions with this comprehensive guide. Learn how to calculate the mean, variance, and standard deviation, and grasp the concept of expected value through practical examples. We illustrate the structure of a discrete probability distribution, with outcomes on the left and their probabilities summing to 1 on the right. Explore TI-84 calculations for analyzing different scenarios, ranging from rolling dice to raffle ticket outcomes. Understand the interpretation of expected value in real-world contexts, ensuring a solid foundation in discrete probability.

E N D
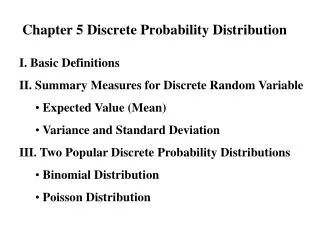
Discrete Probability Distribution Calculations Mean, Variance, Standard Deviation Expected Value
Remember the Structure Required features Example of a Discrete Probability Distribution • The left column lists the sample space outcomes. • The right column has the probability of each of the outcomes. • The probabilities in the right column must sum to exactly 1.0000000000000000000.
The Formulas • MEAN: • VARIANCE: • STANDARD DEVIATION:
TI-84 Calculations • Put the outcomes into a TI-84 List (we’ll use L1) • Put the corresponding probabilities into another TI-84 List (we’ll use L2) • 1-Var Stats L1, L2 • You can type fractions into the lists, too!
Practice Calculations Rolling one die Statistics The mean is The variance is The standard deviation is
Practice Calculations Statistics Total of rolling two dice • The mean is • The variance is • The standard deviation is
Practice Calculations One Coin Statistics The mean is The variance is The standard deviation is
Practice Calculations Statistics Four Coins • The mean is • The variance is • The standard deviation is
Expected Value Problems The Situation The Discrete Probability Distr. • 1000 raffle tickets are sold • You pay $5 to buy a ticket • First prize is $2,000 • Second prize is $1,000 • Two third prizes, each $500 • Three more get $100 each • The other ____ are losers. What is the “expected value” of your ticket?
Expected Value Problems Statistics The Discrete Probability Distr. • The mean of this probability is $ - 0.70, a negative value. • This is also called “Expected Value”. • Interpretation: “On the average, I’m going to end up losing 70 cents by investing in this raffle ticket.”
Expected Value Problems Another way to do it The Discrete Probability Distr. • Use only the prize values. • The expected value is the mean of the probability distribution which is $4.30 • Then at the end, subtract the $5 cost of a ticket, once. • Result is the same, an expected value = $ -0.70
An Observation • The mean of a probability distribution is really the same as the weighted mean we have seen. • Recall that GPA is a classic instance of weighted mean • Grades are the values • Course credits are the weights • Think about the raffle example • Prizes are the values • Probabilities of the prizes are the weights