Probability distribution
Probability distribution. Dr. Deshi Ye College of Computer Science, Zhejiang University yedeshi@zju.edu.cn. Outline. Random variable The Binomial distribution The Hypergeometric Distribution The Mean and the Variance of the a Probability distribution. Random variables.


Probability distribution
E N D
Presentation Transcript
Probability distribution Dr. Deshi Ye College of Computer Science, Zhejiang University yedeshi@zju.edu.cn
Outline • Random variable • The Binomial distribution • The Hypergeometric Distribution • The Mean and the Variance of the a Probability distribution.
Random variables • We concern with one number or a few number that associated with the outcomes of experiments. • EX. Inspection: number of defectives road test: average speed and average fuel consumption. In the example of tossing dice, we are interested in sum 7 and not concerned whether it is (1,6) or (2, 5) or (3, 4) or (4, 3) or (5, 2) or (6, 1).
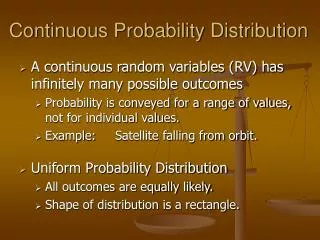
Definition • A random variable: is any function that assigns a numerical value to each possible outcome of experiments. • Discrete random variable: only a finite or a countable infinity of values. Otherwise, continuous random variables.
Probability distribution • The probability distribution of the random variable: is the probabilities that a random variable will take on any one value within its range. • The probability distribution of a discrete random variable X is a list of possible values of X together with their probabilities The probability distribution always satisfies the conditions
Checking probability distribution • Another • f(x) = (x-2)/2, for x=1,2, 3, 4 • H(x) =x2/25, x=0,1,2,3,4
Cumulative distribution • F(x): value of a random variable is less than or equal to x.
Binomial Distribution • Foul Shot: 1. Min Yao (Hou) .862. 2. O’Neal Shaquille .422 • The Question is: what is the probability of them in two foul shots that they get 2 points, respectively?
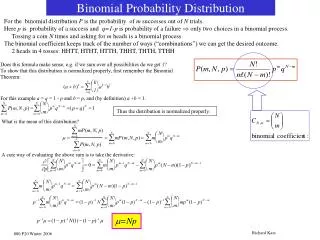
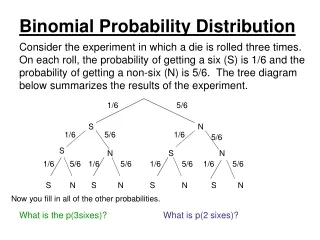
Binomial distribution • Study the phenomenon that the probability of success in repeat trials. • Prob. of getting x “success” in n trials, • otherwords, x “success” and n – x failures in n attempt.
Bernoulli trials • 1. There are only two possible outcomes for each trial. • 2. The probability of success is the same for each trial. • 3. The outcomes from different trials are independent . • 4’. There are a fixed number n of Bernoulli trials conducted.
Let X be the random variable that equals the number of success in n trials. p and 1- p are the probability of “success” and “failure”, the probability of getting x success and n-x failure is
Def. of Binomial Dist. • #number of ways in which we can select the x trials on which there is to be a success is • Hence the probability distribution of Binomial is
Expansions Binomial coefficient
Table 1 • Table 1: Cumulative Binomial distribution
EX Solve • Foul shot example: Here n=2, x=2, and p=0.862 for Yao, and p=0.422 for Shaq.
Skewed distribution Positively skewed
Hypergeometric Distr. • Sampling with replacement • Sampling without replacement
Hyergeometric distr. • Sampling without replacement • The number of defectives in a sample of n units drawn without replacement from a lot containing N units, of which are defectives. Here: population is N, and are total defectives Sampling n units, what is probability of x defectives are found?
formulations • Hypergeometric distr.
Discussion • Is Hypergeometric distribution a Bernolli trial? • Answer: NO! The first drawing will yield a defect unit is a/N, but the second is (a - 1)/(N-1) or a/(N-1).
EX • A shipment of 20 digital voice recorders contains 5 that are defective. If 10 of them are randomly chosen for inspection, what is the probability that 2 of the 10 will be defective? • Solution: a=5, n=10, N=20, and x=2
Expectation • Expectation: If the probability of obtaining the amounts then the mathematical expectation is
Motivations • The expected value of x is a weighted average of possible values that X can take on, each value being weighted by the probability that X assumes it. • Frequency interpretation
4.4 The mean and the variance • Mean and variance: two distributions differ in their location or variation • The mean of a probability distribution is simply the mathematical expectation of a random variable having that distribution. • Mean of discrete probability distribution Alternatively,
EX • The mean of a probability distribution measures its center in the sense of an average. • EX: Find the mean number of heads in three tosses. • Solution: The probabilities for 0, 1, 2, or 3 heads are 1/8, 3/8, 3/8, and 1/8
Mean of Binomial distribution • Contrast: please calculate the following
Mean of b() • Mean of binomial distribution: Proof.
Mean of Hypergeometric Distr. Proof. Similar proof or using the following hints:
EX • 5 of 20 digital voice records were defectives ,find the mean of the prob. Distribution of the number of defectives in a sample of 10 randomly chose for inspection. • Solution: n=10, a= 5, N=20. Hence
Expectation of a function of random variable • Let X denote a random variable that takes on any of the values -1,0,1 respective probabilities • P{x=-1}=0.2, P{x=0}=0.5, P{x=1}=0.3 • Compute E[X2] • Answer = 0.5
Proposition • If X is a discrete random variable that takes on one of the value of xi, with respective to probability p(xi), then for any real-valued function g,
Variance of probability • Variance of a probability distribution f(x), or that of the random variable X which has that probability distribution, as We could also denote it as
Standard deviation • Standard deviation of probability distribution
Ex. • Find the variance of the number of heads in four tosses. • Solution:
Variance of binomial distr. • Variance of binomial distribution: Proof. Detailed proof after the section of disjoint probability distribution
Some properties of Mean • C is a constant, then E(C) = C. • X is a random variable and C is a constant E(CX) = CE(X) • X and Y are two random variables, then E(X+Y) = E(X)+E(Y) If X and Y are independent random variables E(XY) = E(X)E(Y)