Continuous Probability Distribution
Continuous Probability Distribution.


Continuous Probability Distribution
E N D
Presentation Transcript
The Math we looked at last chapter dealt with discrete data – meaning that the values being used were finite in number (ie. Whole numbers), however many calculations in nature are of a continuous value, ie. height of a human which require fractions or decimals. Just like discrete data, continuous data has statistical distributions. Since there are continuous values, the graph is depicted as a smooth curve instead of a bar graph.
Draw a curve that is symmetrical in shape (an inverted parabola). We can notice that there is an equal shape if we cut the curve in half. This curve is smooth in nature and models some things found in this world. A distribution that is not symmetrical is POSITIVELY SKEWED (tail pulled to the right) or NEGATIVELY SKEWED (tail pulled to the left)
These are examples of a set of discrete values that result in one hump (unimodal). A distribution with two humps is called bimodal For example, a population consists of two groups with different attributes. Ie, the distribution of shoe sizes since men tend to have larger feet than women do. Each hump represents the mode of a gender’s shoe size. Men’s Size Women’s Size
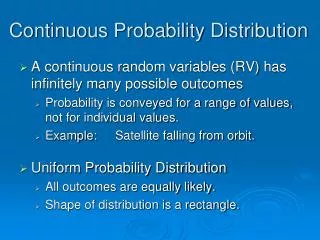
Often we want to find the probability that a variable falls in a particular range of values. This kind of probability can be determined from the area under the distribution curve. Probabilities in Uniform Distribution – this means that the prob of achieving a value is the same for each option.
Example 1. It takes between 195 min and 240 minutes to get from Fruitland to Sundridge. What is the probability that the drive will take less than 210 min? The graph is uniform in size, which means that it is equally likely to achieve a time in the range. It is a straight line between these points. The total area under the line must equal 1 since all the possible driving times lie in the range 195 to 240 minutes.
Exponential Distribution Predicts the WAITING time b/w consecutive events in any random sequence of events.
The y-intercept of the curve is equal to k, so we can easily estimate the mean from the graph if it was provided.
Distributions can be represented by a relative frequency table, graph or equation. Value Frequency Cumulative Frequency Relative frequency Example. Determine the distribution of shoe sizes using your class. Put the information into a relative frequency table.
Homework pg 419 # 1,2, 3abc,4