Probability Distribution
Probability Distribution. Prof. Benilda Ramos-Butron Philippine Normal University. Probability Distribution. Describes how probabilities are distributed in a sample space Discrete probability distribution Continuous probability distribution. Types of Discrete Probability Distribution.


Probability Distribution
E N D
Presentation Transcript
Probability Distribution Prof. Benilda Ramos-Butron Philippine Normal University
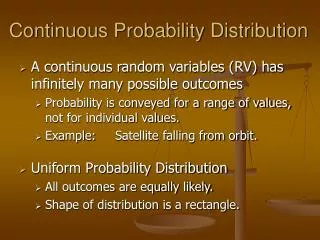
Probability Distribution • Describes how probabilities are distributed in a sample space • Discrete probability distribution • Continuous probability distribution
Types of Discrete Probability Distribution • Binomial Distribution • Conditions in a binomial distribution • It is a series of trials with only two possible outcomes for each trial • The trials are independent of one another • Given a fixed number of trials, we desire to find a certain mixture of the outcomes
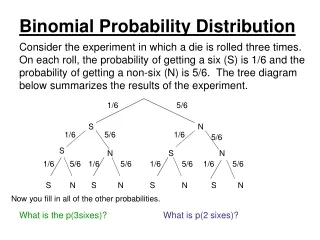
Binomial Distribution • Example 1: A fair coin is tossed until a tail appears, or three times which ever comes first. Let x represent the number of tosses, y the number of heads in one experiment and z the number of tail. Determine the probability distribution of x, y, and z.
Binomial Distribution • Make a table showing the various possible outcomes and their probabilities. • Let P(x), P(y) and P(z) be the probabilities of x, y, and z respectively.
x P(x) • ½ • ¼ • ¼ • Sum = 1 • y P(y) • 0 ½ • ¼ • 1/8 • 1/8 • Sum = 1 • z P(z) • 0 1/8 • 7/8 • Sum = 1
Binomial Distribution • Analysis • For the first toss, the probability is ½ because there are only two outcomes which are equally likely. • For the second toss, a tail occurs only if a head appears in the first toss. • The probability of getting a head for the first and second toss is ¼, but from the definition of the nature of the experiment, a third toss is necessary, with a probability of obtaining a head or a tail is ½. Thus, for the third event, we obtain 1/8 for either a head or a tail. • The sum of the probabilities for each variable is one
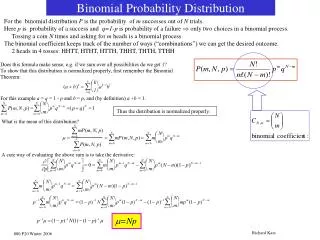
Binomial Distribution • The probability of success is usually symbolized by p and the probability of failure by q. If a binomial experiment has n trials and the probability of “success” on one trial is p, the probability of exactly x successes is given by
Binomial Distribution p – probability of success q – probability of failure n – number of trials x – number of successes
Binomial Distribution Example 2: JLD Supermarket plans to open 6 branch outlets in Metro Manila. From experience, they know that 20% of the new outlets will experience difficulty in penetrating the sales region and fail. Using this estimate, determine the probability distribution for the number of these outlets which will fail.
Binomial Distribution • Use the equation given, to solve example. How many outlets will most probably fail?
Binomial Distribution • Solving for the mean and variance of a binomial distribution Mean = µ = np Variance = δ² = np(1-p) Standard variation = square root of δ² n – number of trials p – probability of success
Binomial Distribution Example 3. A survey on the economic status of 15,000 employees abroad showed that 70% are successful while 30% failed. A case history of 20 employees are now under study. What is the probability that more than 12 of them are successful? Find the mean, variance and standard deviation.
Binomial Distribution • Exercises • In a genetic study of fruit fly Drosophila, mutation is induced by X-rays, UV radiation or any high energy radiation. Suppose that a generation of 30,000 Drosophila flies are subjected to X-rays what is the probability that a mutation will occur in at least one fruit fly? The probability of success is 0.0002.
2. Poisson Distribution • Useful in decision-making with respect to quality control situations, waiting line problems, and other application to business • This is focused on the mean number of occurrences per unit time, distance or area
Poisson Distribution • Assumptions: • Independence of occurrences • Uniform distribution of occurrences over the interval • Independence of starting point
Poisson Distribution • Formula:
Poisson Distribution Example: A plate glass windows produced by a chemical process contains 0.015 bubbles per sq. meter. Monica wanted to buy a 10-by 2-meter plate glass window. a) Find the probability that it will have no bubbles in it. b) Find the probability that it will have 5 bubbles in it.
Poisson Distribution Properties: Mean: µ = m Variance: δ² = m Standard Deviation δ = sqrt of m
Poisson Distribution Exercise: In Butag Bay, Sorsogon the number of fish caught per man-hour of fishing effort has a Poisson distribution with m equal to 1.3 fish per man-hour find the probability that: a. 4 fishes will be caught by one man fishing 2 hours b. 8 fishes will be caught by 3 women fishing for 2 hours