Download
1 / 18
180 likes | 270 Vues
This presentation discusses measuring transit coverage level of service in U.S. border cities, exploring the Service Coverage-Level Of Service (SC-LOS) concept, methodology, data collection, and results. It compares traditional methods like TCQSM with author's suggested approaches to account for unique challenges in border regions. The study reveals insights into improving transit support and coverage in such areas.

E N D
Measuring Transit-Coverage Level-Of-Service in U.S. Border Cities Luis David Galicia, Ph.D. Texas A&M Transportation Institute https://plus.google.com/108921303273699318714/photos?hl=en https://plus.google.com/108921303273699318714/photos?hl=en
Overview of Presentation Background and Problem Statement Literature Review Case Study Hypothesis Data Collection Methodology Results and Conclusions
Background A similar concept, Service Coverage-Level Of Service (SC-LOS), was adopted in the first edition of Transit Capacity and Quality of Service Manual (TCQSM) in 2004 The LOS is divided in 6 categories being “A” the highest and “F” the lowest
0.25 mile Service Coverage is defined by the TCQSM as “the availability a potential transit user has to access the transit system within a reasonable walking distance (typically ¼ of a mile) from the user’s origin or the user’s final destination”
Problem Statement Source: The El Paso del Norte Group Is the SC-LOS suitable for border cities/regions in the U.S?
What the Literature Says.. • Transit Supportive Area (TSA) concept* is included in TCQSM-Chapter 3 (2nd Edition) and Chapter 5 (3rd Edition) “Fixed-Route Transit Service Measures” *Pushkarev, B., J. M. Zupan. Public Transportation and Land Use Policy. Bloomington, IN. Indiana University Press, 1977 Source: TCQSM 2nd Edition
Hypothesis Even though the TCQSM and TLOS help planners shape the areas that support transit route coverage, these methodologies might not lead to the most accurate results at border cities/regions The TSA concept might “exclude” transit riders that have their work-base trips originated in other areas
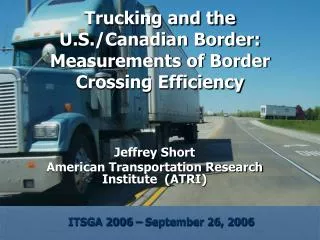
Data Collection Shapefiles provided by local MPO, and other web sources City of El Paso (Passenger Counts) Sun Metro’s Official Route Shapefiles GIS Spatial Analysis (2009) TTI’s O-D Survey
Author’s suggested method…Step 1 • Off-Board Origin Destination Intercept Survey
Author’s suggested method…Step 4(Recalculation of SC-LOS based on OD Survey)
Conclusions The hypothesis was confirmvia the suggested methodology The occurrence of work-based trip attraction at TAZs with almost no employment suggests that the work trips are for household services The portion of TSAs covered by the transit service increased by approximately 5% just by adding some TSAs with relatively high passenger volumes (although these TSAs have low household density or employment) TCQSM’s TSA and SC-LOS determination methodology may not cover border regions with special trip generators or attractors, such as the one presented in this research
Further Analysis Refinement of actual walking distances Use of other border cities with similar conditions as case studies (USA-MEX and USA-CAN) Use of up-to-date ridership data Suggestions?