Download
1 / 26
260 likes | 454 Vues
Issues and Answers in Quality Control of LIDAR DEMs for North Carolina DFIRMs. Gary W. Thompson, RLS North Carolina Geodetic Survey David F. Maune, Ph.D., C.P. Dewberry & Davis LLC, Fairfax, VA. Hurricane Floyd — 1999. Revealed limitations in the State’s flood hazard data and maps

E N D
Issues and Answers in Quality Control of LIDAR DEMs forNorth Carolina DFIRMs Gary W. Thompson, RLS North Carolina Geodetic Survey David F. Maune, Ph.D., C.P. Dewberry & Davis LLC, Fairfax, VA
Hurricane Floyd — 1999 • Revealed limitations in the State’s flood hazard data and maps • Many maps compiled in the 1970s by approximate methods; no detailed H&H • Most of NC needed to be remapped digitally, consistent with FEMA’s Map Modernization Plan • Over 50 counties needed re-mapping immediately with new DFIRMs
Topography Flood Data Base + + = DFIRM DFIRM Components
Cooperating Technical State (CTS) • North Carolina, FEMA’s first CTS, is responsible for: • Re-surveying the State • Conducting flood hazard analyses • Producing updated DFIRMs • North Carolina Geodetic Survey (NCGS) serves as the State’s technical lead • Dewberry & Davis LLC serves as FEMA’s Map Coordination Contractor (MCC)
Photogrammetry or LIDAR? • The North Carolina advertisement did not specify technologies to be used • Focus was on high-resolution andhigh-accuracy digital elevation data suitable for semi-automated H&H modeling • All firms proposed using LIDAR to generate the TINs and DEMs; but some proposed using photogrammetry to generate breaklines
Winning Teams • Watershed Concepts team includes: • EarthData International (LIDAR) • ESP Associates (ground surveying) • Greenhorne & O’Mara team includes: • 3Di EagleScan (LIDAR) • McKim & Creed (ground surveying) • Hobbs, Upchurch & Assoc. (ground surveying)
Delivery Order No. 1 • Task 1: LIDAR Data Acquisition • Vertical RMSE = 20 cm in coastal areas and 25 cm inland (equivalent contour interval of 2.16’ and 2.70’), the highest accuracy realistically achievable • This was a compromise from FEMA’s15-cm LIDAR standard, considered unrealistic based on prior studies • Daily calibration at local test site • Task 2: Generation of Bare-Earth ASCII files (randomly spaced)
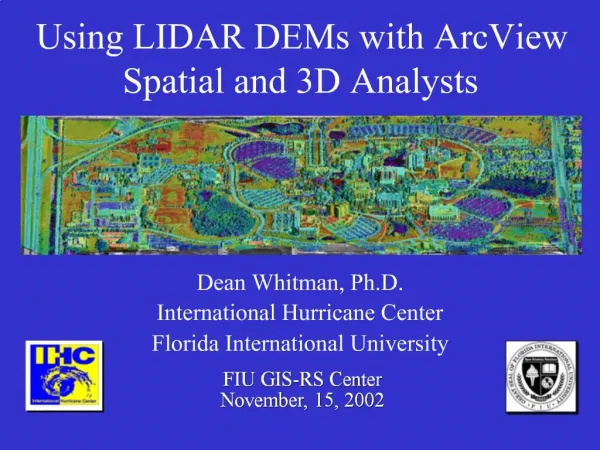
LIDAR Laser Sensor • Laser scanner with mirror measures scan angles and distances for up to 50,000 pulses per second • Airborne GPS measures position • Inertial Measuring Unit (IMU) measures roll, pitch, heading • Record first/last returns
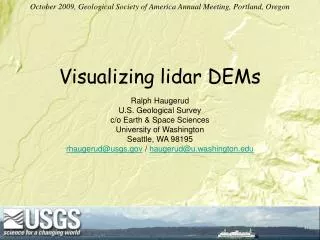
Issue: How best to perform LIDAR system calibrationCourtesy of EarthData International
Issue: How best to post-process LIDAR (These are “raw” images)Courtesy U.S. Army Topographic Engineering Center
Bare-earth data (post processed for vegetation/building removal)Courtesy U.S. Army Topographic Engineering Center
Delivery Order No. 1 (continued) • Task 3: Generation of Triangulated Irregular Network (TIN) and breaklines • Task 4: Development of 5m x 5m DEMs in ESRI GRID Float Format • Task 5: Development of DEMs in Three Additional File Formats • Task 6: Preparation of Project Report • Task 7: Production of Optional Digital Orthophoto Images
Digital Elevation Models (DEMs) • DEMs typically have uniform “post spacing” where x/y coordinates are evenly divisible by 5m, 10m, 30m, etc. • Interpolated from TIN data; e.g., LIDAR. • Neither TIN nor DEMpoints are clearly defined on the ground.
TINs — Superior for 3-D Surface Modeling; e.g., H&H Modeling • A TIN is a set of adjacent, non-overlapping triangles computed from irregularly spaced mass points with x,y coordinates and z values, plus breaklines. • Mass points can come from LIDAR or other source. • Best breaklines come from photogrammetry, then digital orthophotos.
Hydraulic Models Require “Representative” Cross Sections • Cross sections are carefully selected to be representative of reaches that are as long as possible, without permitting excessive conveyance change between sections. • Typically between 500’ and 2,500’ apart. • In addition to surveyed cross sections, others can be “cut” from the LIDAR data.
Watershed Concepts Surveyed cross sections at bridges Hydro-enforced stream centerlines Digital orthophoto breaklines at stream shorelines LIDAR models stream banks and overbank areas Greenhorne & O’Mara Surveyed cross sections at bridges Hydro-enforced stream centerlines Photogrammetric breaklines at tops and bottoms of stream banks LIDAR models overbank areas Issue: How best to generate Breaklines
Issue: How best to handle “obscured areas” and “artifacts”
Issue: How best to compute RMSEz of bare-earth TINs/DEMs Since TIN/DEM points not clearly defined: • Survey a minimum of 20 checkpoints in all 5 major land cover categories representative of the floodplain • Choose checkpoints on flat or uniformly sloping terrain; interpolate LIDAR points • Use no checkpoints in vegetation known to be too dense for LIDAR penetration • Discard 5% of “outliers”
Issue: Check points in such areas skew RMSE calculations • LIDAR has fewer areas than photogrammetry where the terrain is obscured. • One “bad” checkpoint in such areas will over-ride 1,000 “good” checkpoints elsewhere, and thus skew the results.
LIDAR Advantages Compared with Photogrammetry • LIDAR needs only a single line-of-sight to measure through/between trees • High-altitude LIDAR data are more accurate than from photogrammetry • LIDAR generates higher-density TINs/DEMs at lower costs • LIDAR acquires data both day and night (but not through clouds)
LIDAR Disadvantages Compared with Photogrammetry • LIDAR returns on water are unreliable • LIDAR is ill-suited for breaklines; e.g., 5-m point spacing could “jump” across a breakline • LIDAR is new technology; standards have not yet been developed • Contour lines are not as smooth • Streams are not automatically hydro-enforced, must be done manually
LIDAR contours not hydro-enforced(same problem with TINs/DEMs)
Conclusions • This project will demonstrate the do’s and don’ts of LIDAR for H&H modeling and serve as a model for years to come • This project will also be used to update FEMA standards
Issues and Answers in Quality Control of LIDAR DEMs forNorth Carolina DFIRMs QUESTIONS? ? ? ? ?