Parabolas: Graphing Parabolas
Parabolas: Graphing Parabolas. Section 4.1. Definitions. Quadratic Equation is viewed as, a x 2 + b x + c = 0, where a ≠ 0 Parabola is an “u-shaped” graph If a is positive, it opens up If a is negative, it opens down Vertex is the highest or lowest point of the graph

Parabolas: Graphing Parabolas
E N D
Presentation Transcript
Parabolas: Graphing Parabolas Section 4.1 4.1 - Graphing Parabolas
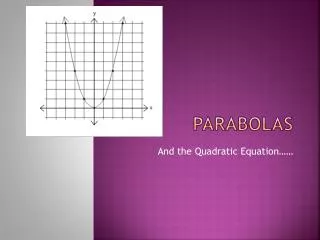
4.1 - Graphing Parabolas Definitions • Quadratic Equation is viewed as, ax2 + bx + c = 0, where a ≠ 0 • Parabola is an “u-shaped” graph • If a is positive, it opens up • If a is negative, it opens down • Vertex is the highest or lowest point of the graph • Axis of Symmetry is the vertical line passing though the vertex (x of vertex) represented by a DOTTED-line • Roots are also generally known as x-intercepts or solutions. It is where the graph crosses the x-axis
4.1 - Graphing Parabolas Definitions y = x2 – 4 X-intercept(s): Point(s) where the graph crosses the x-axis. Roots: The solutions to the equation . Ordered Pair: (–2, 0) Ordered Pair: (2, 0) Vertex: Minimum or maximum value Axis of Symmetry: Line that separates the graph in half; always is x equals
4.1 - Graphing Parabolas Equations • Quadratic equation: ax2 + bx + c = y • To find vertex:
4.1 - Graphing Parabolas Definitions • Quadratic Equation is viewed as, ax2 + bx + c = 0, where a ≠ 0 • Parent Functions of Parabola: y = x2 Change of a Change of c
4.1 - Graphing Parabolas The change in c • For shifts of c of ax2 + bx + c = y, the change of the c, the y-intercept shifts up or down
4.1 - Graphing Parabolas The change in a • For shifts of a of ax2 + bx + c = y, the bigger the a, the smaller the graph gets.
4.1 - Graphing Parabolas Steps • Make sure the parabola is in standard form, ax2 + bx + c = 0, where a ≠ 0 • Determine the vertex by using the equation, -b/2a • Determine the additional points by plugging in at least 4 additional points • Draw the arrowed graphs
4.1 - Graphing Parabolas Example 1 Determine the vertex of y = x2 – 4 and sketch the graph Is it in standard form? YES Determine the vertex.
4.1 - Graphing Parabolas Example 1 Determine the vertex of y = x2 – 4, sketch the graph, and describe the shift of the function Determine the vertex. To solve for x, plug into the equation, x = -b/2a
4.1 - Graphing Parabolas Example 1 Determine the vertex of y = x2 – 4, sketch the graph, and describe the shift of the function Determine the vertex. To solve for y of the vertex, plug the x into the equation
4.1 - Graphing Parabolas Definitions y = x2 – 4 X-intercept(s): Point(s) where the graph crosses the x-axis. Root(s): The solutions to the equation . Ordered Pair: (–2, 0) Ordered Pair: (2, 0) Vertex: Minimum or maximum value (0, –4) Axis of Symmetry: Line that separates the graph in half; always is x equals
4.1 - Graphing Parabolas Example 2 Determine the vertex of y = x2 – 9 and sketch the graph
4.1 - Graphing Parabolas Example 3 Given equation: y = x2 – 9 • Determine: • How it opens • Shift from the Parent Function • The Vertex • Roots • Y-Intercept • Axis of Symmetry • Domain • Range • Minimum/Maximum
4.1 - Graphing Parabolas Example 3 Given y = x2 – 9 • How it opens? • Is the leading coefficient positive or negative? POSITIVE OPENS UP
4.1 - Graphing Parabolas Example 3 From this equation: y = x2 – 9 • The shift from the parent function Moves 9 spots down
4.1 - Graphing Parabolas Example 3 • From this equation, identify the X-coordinate of the vertex y = x2 – 9 • Plug the equation in
4.1 - Graphing Parabolas Example 3 • From this equation, identify the Y-coordinate of the vertex y = x2 – 9 • Plug the equation in
4.1 - Graphing Parabolas Example 3 Given y = x2 – 9 • The vertex:
4.1 - Graphing Parabolas Example 3 Roots are where they cross the x-axis – Solve for x WHERE Y = 0
4.1 - Graphing Parabolas Example 3 From this equation: y = x2 – 9 • Y-intercept: y =(0, –9)
4.1 - Graphing Parabolas Example 3 Given y = x2 – 9 • Axis of Symmetry is the X of the vertex.
4.1 - Graphing Parabolas Example 3 • Domain is the listing of all of the x-coordinates ALL REAL NUMBERS (–∞, ∞)
4.1 - Graphing Parabolas Example 3 • Range is the listing of all of the y-coordinates y >-9 [–9, ∞) > > arrow u >
4.1 - Graphing Parabolas Your Turn • Given equation: y = x2 – 16 • Determine: • How it opens • Shift from the Parent Function • Roots • Y-Intercept • The Vertex • Axis of Symmetry • Domain • Range • Minimum/Maximum
4.1 - Graphing Parabolas Your Turn • Given equation, y = x2 – 16 • Determine: • How it opens • Shift from the Parent Function • Roots • Y-Intercept • The Vertex • Axis of Symmetry • Domain • Range • Minimum/Maximum up Down 16 (±4, 0) (0, -16) (0, -16) x = 0 All Reals y > -16 Min at -16
4.1 - Graphing Parabolas Example 3 • Given equation, y = 2x2 – 2 • Determine: • How it opens • Shift from the Parent Function • Roots • Y-Intercept • The Vertex • Axis of Symmetry • Domain • Range • Minimum/Maximum up Down 2 and compresses with a scale of 2 (1, 0) and (-1, 0) (0, -2) (0, -2) x = 0 All Reals y > -2 Min at -2
4.1 - Graphing Parabolas Example 4 • Given equation, y = 2x2 – 2x + 5 • Determine: • How it opens • Y-Intercept • The Vertex • Axis of Symmetry • Domain • Range • Minimum/Maximum up (0, 5) (0.5, 4.5) x = 0.5 All Real Numbers y > 4.5 Min at 4.5
4.1 - Graphing Parabolas Example 5 • Given equation: y = x2 + 6x + 9 • Roots • The Vertex
4.1 - Graphing Parabolas Example 4 • Given y = x2 + 6x + 9 • Roots: x = (–3, 0) Double Root
4.1 - Graphing Parabolas Example 4 • From this equation, identify the X-coordinate of the vertex y = x2 + 6x + 9 • Plug the equation in
4.1 - Graphing Parabolas Example 4 • From this equation, identify the Y-coordinate of the vertex y = x2 + 6x + 9 • Plug the equation in
4.1 - Graphing Parabolas Your Turn • Given equation: y = x2 + 8x + 16 • Roots • The Vertex
4.1 - Graphing Parabolas Quadratic Equation • Use the quadratic equation: f(x) = a(x – h)2 + k • To find vertex: • a:Reflection/Scaled stretch • h: Horizontal Translation • k: Vertical Translation (also known as ‘c’)
4.1 - Graphing Parabolas Example 5 • Given equation: y = (x + 4)2 – 9 • Determine: • How it opens • Shift from the Parent Function • Roots • Y-Intercept • The Vertex • Axis of Symmetry • Domain • Range • Minimum/Maximum
4.1 - Graphing Parabolas Example 5 • Given y = (x + 4)2 – 9 • How it opens? • Is the leading coefficient positive or negative? POSITIVE OPENS UP
4.1 - Graphing Parabolas Example 5 • Given y = (x + 4)2 – 9 • The shift from the parent function Down 9, left 4 spots
4.1 - Graphing Parabolas Example 5 • Given y = (x + 4)2 – 9 • Roots: x = (–7, 0) and (–1, 0)
4.1 - Graphing Parabolas Example 5 • Given y = (x + 4)2 – 9 • Y-intercept: y = (0, 7)
4.1 - Graphing Parabolas Example 5 • From this equation, identify the X-coordinate of the vertex y = (x + 4)2 – 9
4.1 - Graphing Parabolas Example 5 • Given: y = (x + 4)2 – 9 • The vertex:
4.1 - Graphing Parabolas Example 5 Given: y = (x + 4)2 – 9 Axis of Symmetry is the X of the vertex.
4.1 - Graphing Parabolas Example 5 • Domain is the listing of all of the x-coordinates ALL REAL NUMBERS
4.1 - Graphing Parabolas Example 5 • Range is the listing of all of the y-coordinates y >-9 arrow u >
4.1 - Graphing Parabolas Example 6 • Given equation: y = –(x – 3)2 + 5 • Determine: • How it opens • Shift from the Parent Function • Roots • Y-Intercept • The Vertex • Axis of Symmetry • Domain • Range • Minimum/Maximum down Right 3, Up 5 (0, -2) (0, -2) x = 0 All Reals y < -2 Min at -2
4.1 - Graphing Parabolas Your Turn • Given equation: y = 2(x + 3)2 - 6 • Determine: • How it opens • Shift from the Parent Function • Roots • Y-Intercept • The Vertex • Axis of Symmetry • Domain • Range • Minimum/Maximum up Left 3, Down 6, (0, -6) (-3, -6) x = -3 All Reals y > -6 Min at -6
4.1 - Graphing Parabolas Assignment WKST