Parabolas
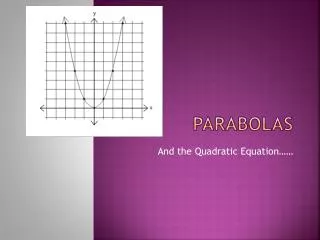
Parabolas. The Basic Parabola. - The parabola is a quadratic graph linking y and x 2. - The basic parabola is y = x 2. e.g. Complete the table below by using the rule y = x 2 to find and plot co-ordinates to draw the basic parabola. (-2) 2. 4. (-1) 2. 1. 0. 1. 4. VERTEX.

Parabolas
E N D
Presentation Transcript
The Basic Parabola - The parabola is a quadratic graph linking y and x2 - The basic parabola is y = x2 e.g. Complete the table below by using the rule y = x2to find and plot co-ordinates to draw the basic parabola. (-2)2 4 (-1)2 1 0 1 4 VERTEX Note: the points of a basic parabola are easily drawn from the vertex by stepping out one and up one, then out two and up four, then out three and up nine etc...
Plotting Points - As with straight line graphs we can use a rule to find and plot co-ordinates in order to draw any parabola. e.g. Complete the tables below to find co-ordinates in order to plot the following parabolas: a) y = x2 – 3 b) y = x2 + 2 c) y = (x + 1)2 d) y = (x – 1)2 (-2)2 – 3 1 (-2)2 + 2 6 (-1)2 – 3 -2 (-1)2 + 2 3 -3 2 -2 3 1 6 1 9 (-2 + 1)2 (-2 – 1)2 0 4 (-1 + 1)2 (-1 – 1)2 1 1 4 0 9 1
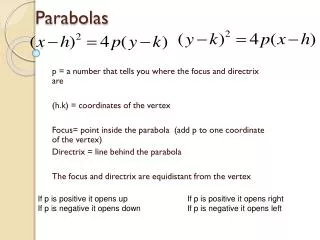
Transformations of the Basic Parabola 1. Up or Down Movement - When a number is added or subtracted at the end, the basic parabola moves vertically e.g. Draw the following parabolas: a) y = x2 b) y = x2 + 1 c) y = x2 – 5 To draw vertical transformations, first find the position of the vertex Then draw in basic parabola shape
2. Left or Right Movement - When a number is added or subtracted in the brackets, the basic parabola moves horizontally but opposite in direction e.g. Draw the following parabolas: a) y = x2 b) y = (x + 3)2c) y = (x – 2)2 To draw horizontal transformations, first find the position of the vertex Then draw in basic parabola shape
3. Combined Movements e.g. Draw the following parabolas: a) y = (x – 4)2 – 8 b) y = (x + 3)2 + 3 c) y = (x – 7)2 + 4 d) y = (x + 6)2 – 5 To draw combined transformations, first find the position of the vertex Then draw in basic parabola shape
Changing the Shape of the Basic Parabola 1. When x2 is multiplied by a positive number other than 1 - the parabola becomes wider or narrower - Set up a table and use the rule to find and plot co-ordinates e.g. Complete the tables and draw y = 2x2 and y = ¼x2 2 × (-2)2 8 ¼ × (-2)2 1 2 × (-1)2 2 ¼ × (-1)2 ¼ 0 0 2 ¼ 8 1 Use the grid to determine the x-values to put into your table
1. When x2 is multiplied by a negative number - it produces an upside down parabola - all transformations are the same as for a regular parabola e.g. Draw the following parabolas: y = -x2 y = -(x + 2)2 First find placement of the vertex When plotting points move down instead of up. y = -(x – 1)2 + 2
Factorised Parabolas Method 1: Set up a table, calculate and plot points Use the grid to determine the x-values to put into your table e.g. Draw the parabola y = (x – 3)(x + 1) (-3 – 3)(-3 + 1) 12 (-2 – 3)(-2 + 1) 5 0 -3 -4 -3 0
Method 2: Calculating and plotting specific features e.g. Draw the parabola y = (x – 3)(x + 1) 1. x-axis intercepts (where y = 0) solving quadratics: 0 = (x – 3)(x + 1) x = 3 and -1 2. y-axis intercept (where x = 0) y = (0 – 3)(0 + 1) y = -3 3. The position of the vertex - is halfway between x-axis intercepts - substitute x co-ordinate into equation to find y co-ordinate y = (1 – 3)(1 + 1) y = -4 Vertex = (1, -4) 4. Join the points with a smooth curve
e.g. Draw the parabola y = x(x – 4) 1. x-axis intercepts 0 = x(x – 4) x = 0 and 4 2. y-axis intercept y = 0(0 – 4) y = 0 3. Position of vertex y = 2(2 – 4) y = -4 Vertex = (2, -4) e.g. Draw the parabola y = (1 – x)(x – 5) 1. x-axis intercepts 0 = (1 – x)(x – 5) x = 1 and 5 2. y-axis intercept y = (1 – 0)(0 – 5) y = -5 3. Position of vertex y = (1 – 3)(3 – 5) y = 4 Vertex = (3, 4) Note: -x indicates parabola will be upside down
Expanded Form Parabolas - Remember you can always set up a table and calculate co-ordinates to plot. - Or simply factorise the expression and plot specific points as shown earlier e.g. Draw the parabolas y = x2 – 2x – 8 and y = x2 + 2x Factorised Expression y = (x – 4)(x + 2) y = x(x + 2) 1. x-axis intercepts x = -2 and 4 x = 0 and -2 2. y-axis intercept y = -8 y = 0 3. Position of vertex Vertex = (1, -9) Vertex = (-1, -1)
Writing Equations - If the parabola intercepts x-axis, you can substitute into y = (x – a)(x – b) - Or, you can substitute the vertex co-ordinates into y = (x – a)2 + b e.g. Write equations for the following parabolas a) y = (x – 2)(x – 4) or Vertex = (3, -1) y = (x – 3)2 – 1 b) Vertex = (-2, 1) y = (x + 2)2 + 1 c) y = (x + 1)(x + 5) - or Vertex = (-3, 4) y = (x + 3)2 + 4 - Always substitute in the opposite sign x-value Add in a negative sign if parabola upside down