
SlideServe
Menu
Préférences
© SlideServe · v2026

Parabolas

kail avatar
17 diapositives · 558 Views · Jul 29, 2014

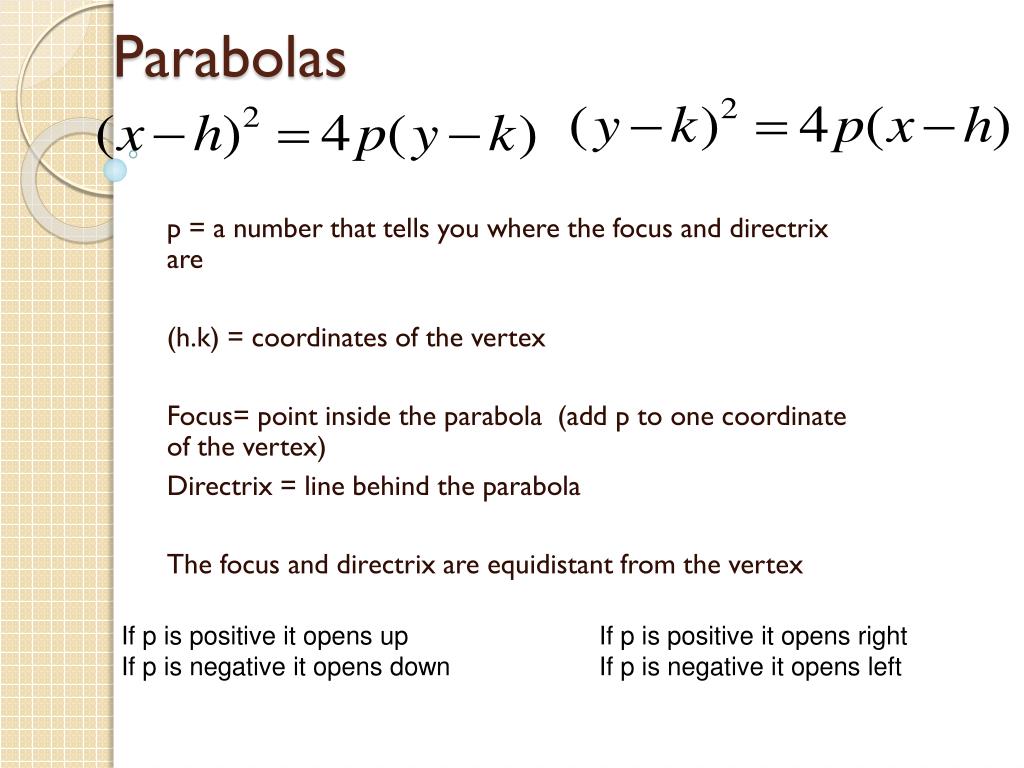
Parabolas. p = a number that tells you where the focus and directrix are ( h.k ) = coordinates of the vertex Focus= point inside the parabola (add p to one coordinate of the vertex) Directrix = line behind the parabola The focus and directrix are equidistant from the vertex.
Parabolas - slide 1
01 / 17Parabolas
1 / 17

Télécharger la présentation

Parabolas
Une image / un lien ci-dessous est fourni (tel quel) pour télécharger la présentation

Politique de téléchargement : le contenu du site vous est fourni TEL QUEL pour votre information et votre usage personnel ; il ne peut être vendu, concédé sous licence ni partagé sur d’autres sites sans l’accord de son auteur.Le contenu vous est fourni TEL QUEL, pour votre information et votre usage personnel uniquement. Téléchargez la présentation en cliquant sur ce lien. Lors du téléchargement, si vous ne parvenez pas à télécharger une présentation, l’éditeur a peut-être supprimé le fichier de son serveur.Pendant le téléchargement, si vous ne parvenez pas à obtenir une présentation, le fichier a peut-être été supprimé par l’éditeur.

F I N

Plus de contenu associé

Transcription de la présentation
  1. Parabolas p = a number that tells you where the focus and directrix are (h.k) = coordinates of the vertex Focus= point inside the parabola (add p to one coordinate of the vertex) Directrix = line behind the parabola The focus and directrix are equidistant from the vertex If p is positive it opens up If p is negative it opens down If p is positive it opens right If p is negative it opens left

  2. To Graph Parabolas • Put it in standard form (Same variables on the same side. Factor and complete the square, if needed) • Decide whether it opens up/down/left/right • Plot vertex • Find focus (add p to vertex) and directrix • Use t-chart to find and plot 2 additional points • Graph

  3. Write the equation of the parabola in standard form. vertical, up Parabolas Vertex: (0, 0)

  4. GRAPH vertex: (0, 0) focus:(0, 2 ) di rectrix: y = - 2 X Y -4 2 4 2

  5. horizontal , left Vertex: (0, 0)

  6. GRAPH tex ver , (0, 0) focus: (-3, 0) di r ec trix : x = 3

  7. Graph. vertical, down h = 1 k = 2 p =? vertex: (1, 2) -4 = 4p p = -1

  8. Graph. vertex: (1, 2) directrix: y = 3 focus: (1, 1)

  9. Graph. horizontal, right 3 = -2 p =? h = k 8 = 4p vertex: (3, -2) 2 = p

  10. Graph. vertex: (3, -2) directrix: x = 1 latus: 8 focus: (5, -2)

  11. Graph. vertical, up h = -1 k p =? = -1 12 = 4p vertex: (-1, -1) 3 = p

  12. Graph. vertex: (-1, -1) directrix: y = -4 latus: 12 focus: (-1, 2)

  13. Not in Standard form? • Identify which variable is squared. Keep each term with that variable on the left. Move everything else to the right. • Complete the square with the left side. • Factor the left side. • On the right side, factor the lead coefficient out of both terms.

  14. Graph. complete the square factor vertical, down h = 1 k = 1 p = -1 vertex: (1, 1) directrix: y = 2 focus: (1, 0)

  15. Graph. vertex: (1, 1) directrix: y = 2 focus: (1, 0)

  16. Homework Page 178: 2 – 22 Even