Parabolas
Parabolas. And the Quadratic Equation……. Terms:. Parabola - The shape of the graph of y = a ( x - h ) 2 + k Vertex - The minimum point in a parabola that opens upward or the maximum point in a parabola that opens downward.

Parabolas
E N D
Presentation Transcript
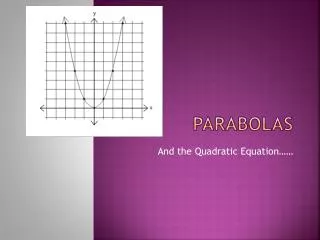
Parabolas And the Quadratic Equation……
Terms: • Parabola - The shape of the graph of y= a(x - h)2 + k • Vertex - The minimum point in a parabola that opens upward or the maximum point in a parabola that opens downward. • Quadratic Equation - An equation of the form ax2 + bx + c = 0, where a ≠ 0, and a, b, and c are real numbers. • Axis of Symmetry - The line which divides the parabola into two symmetrical halves.
Graphing y= x2 • Is this a linear function? • What does the graph of y = x2 look like? • To find the answer, make a data table:
And graph the points, connecting them with a smooth curve: Graph of y = x2
The shape of this graph is a parabola. The parabola does not have a constant slope. In fact, as x increases by 1, starting with x = 0, y increases by 1, 3, 5, 7,…. As x decreases by 1, starting with x = 0, y again increases by 1, 3, 5, 7,…. In the graph of y = x2, the point (0, 0) is called the vertex.
Graph y = x2 + 3 The graph is shifted up 3 units from the graph of y = x2, and the vertex is (0, 3).
Graph y = x2 - 3: The graph is shifted down 3 units from the graph of y = x2, and the vertex is (0, - 3).
We can also shift the vertex left and right. Look at the graph of y = (x + 3)2 The graph is shifted left 3 units from the graph of y = x2, and the vertex is (- 3, 0).
Observe the graph of y = (x - 3)2: The graph is shifted to the right 3 units from the graph of y = x2, and the vertex is (3, 0).
The axis of symmetry is the line which divides the parabola into two symmetrical halves. Axis of Symmetry
As well as shifting the parabola up, down, left, and right, we can stretch or shrink the parabola vertically by a constant. • Data table for the graph of y = 2x2: • Here, the y increases from the vertex by 2, 6, 10, 14,…; that is, by 2(1), 2(3), 2(5), 2(7),….
Graph of y = x2 Graph of y = 2x2
Sometimes, the parabola opens downward. • y = - (x - 2)2 + 3:
What can we find from y= -x2 ? • Which way will the parabola open? • The negative a value indicates - Down • Where is the vertex? • Make a table of values to be sure
What can we find from y= ½ x2 ? • Which way will the parabola open? • The a value is positive - Up • Where is the vertex? • What is the step pattern? • Make a table of values to be sure
What can we find from y = 3x2 + 6x + 1? • Which way will the parabola open? • The a value is positive – Up • What will the vertical stretch be? • What will the step pattern be? • What is the y-intercept?
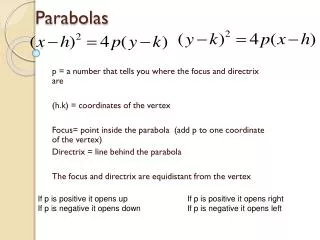
Forms of the Quadratic equation: • Standard form • y = ax2 + bx + c where c is the y-intercept • Vertex form • y = a (x - h)2 + k where (h,k) is the vertex • Factored form • y = a (x - s)(x – t) where s and t are the zeros • For the same parabola, the quadratic equation in any form will have the SAME a value – which indicates the direction of opening and the vertical stretch.