Download
1 / 23
240 likes | 377 Vues
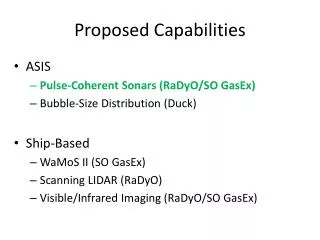
This document outlines proposed capabilities utilizing various advanced sonar and imaging technologies, including Pulse-Coherent Sonars, Scanning LIDAR, and Visible/Infrared Imaging systems for ship-based marine research. These tools will facilitate real-time wave measurements, bubble size distribution analysis, and detailed surface elevation mapping. The goal is to enhance understanding of hydrodynamic processes, wave characteristics, and air-sea interactions through various successful deployments and innovative methodologies in different marine environments like the Southern Ocean and Santa Barbara Channel.

E N D
Proposed Capabilities • ASIS • Pulse-Coherent Sonars (RaDyO/SO GasEx) • Bubble-Size Distribution (Duck) • Ship-Based • WaMoS II (SO GasEx) • Scanning LIDAR (RaDyO) • Visible/Infrared Imaging (RaDyO/SO GasEx)
5 Pulse-coherent Doppler sonars • The sonar system has two beams, each of which measure velocity along the beam over 1 m at 2 cm resolution. The system is vaned into the current and takes data at 4 Hz rate at near 100% duty cycle. • Depth profile of TKE dissipation rate • Successful Deployments • Southern Ocean GasEx 2008 • RaDyO SBC 2008 and RaDyO Hawaii 2009 • Stratus 9 (2008-2010) as part of VOCALS-Rex • Lucky Strike 2010 T/S Drifter with TKE Dissipation Rate Kolmogorov Spectra The turbulent dissipation rate is estimated from the direct wavenumber spectra in the Kolmogorov inertial dissipation range.
Proposed Capabilities • ASIS • Pulse-Coherent Sonars (RaDyO/SO GasEx) • Bubble-Size Distribution (Duck) • Ship-Based • WaMoS II (SO GasEx) • Scanning LIDAR (RaDyO) • Visible/Infrared Imaging (RaDyO/SO GasEx)
2D Directional Spectrum WaMoS II ® Wave Monitoring System WaMoS II & Video Riegl Laser Altimeter TSKA Microwave Wave Height Radar backscatter Sea surface elevation • Some Important Products: • Surface Elevation Maps • 2D wave number direction spectrum • 2D frequency direction spectrum • Significant wave height • Mean, 1st peak, and 2nd peak for the wind sea and swell of the following • Wavelength • Period • Direction Hs= 4.3 m Tp = 10.8 s Dp = 355° Lp = 183 m
SO GasEx Waves Wind Speed, Wave Spectra & Significant Wave Height The WaMoS® II capabilities on the Research Vessel will provide directional wave spectra and individual wave state components at wavelengths of O(15 to 600)m that overlap with the Riegl Q240i scanning Lidar for a continuous wavenumber spectra that spans wavelengths from O(0.05 to 600)m. Wave measurements will be performed from the met platform at the end of the boom that extends out 3 m over the ocean. The Riegl Q240i scanner will be deployed at the end of the boom for the surface wave and wave roughness measurement.
SO GasEx Waves Wind Speed, Wave Frequency, Wave Age & Significant Wave Height
Proposed Capabilities • ASIS • Pulse-Coherent Sonars (RaDyO/SO GasEx) • Bubble-Size Distribution (Duck) • Ship-Based • WaMoS II (SO GasEx) • Scanning LIDAR (RaDyO) • Visible/Infrared Imaging (RaDyO/SO GasEx)
RaDyO Flip Instrumentation Setup Scanning Altimeters Visible Camera Air-Sea Flux Package Infrared Camera Polarimeter
RaDyO Waves from Point and Scanning LIDAR Wave Height and Topography
RaDyO Waves from Point and Scanning LIDAR Wind Speed, Wave Spectra & Significant Wave Height The WaMoS® II capabilities on the Research Vessel will provide directional wave spectra and individual wave state components at wavelengths of O(15 to 600)m that overlap with the Riegl Q240i scanning Lidar for a continuous wavenumber spectra that spans wavelengths from O(0.05 to 600)m. Wave measurements will be performed from the met platform at the end of the boom that extends out 3 m over the ocean. The Riegl Q240i scanner will be deployed at the end of the boom for the surface wave and wave roughness measurement.
Proposed Capabilities • ASIS • Pulse-Coherent Sonars (RaDyO/SO GasEx) • Bubble-Size Distribution (Duck) • Ship-Based • WaMoS II (SO GasEx) • Scanning LIDAR (RaDyO) • Visible/Infrared Imaging (RaDyO/SO GasEx)
RaDyO Flip Instrumentation Setup Scanning Altimeters Visible Camera Air-Sea Flux Package Infrared Camera Polarimeter
Microbreaking IR and POL Movie Polarimeter IR Camera
Sea Surface Roughness Imaging Capability Targeting the small-scale wave roughness features and interact with optical observations and modelers.
Breaking Crest Length Distribution using Infrared Imagery Small-scale wave roughness in Santa Barbara Channel was important to the Breaking Distribution. This bimodality may result from the difference the relaxation of the young and established seas in this rapidly changing wind field. Its possibly linked to the relaxing longer seas are sufficiently nonlinear for breaking to persist. b may vary with wind speed or MSWB becomes less dominant with increasing wind speed? Small-scale wave roughness in Santa Barbara Channel was important to the Breaking Distribution
Additional Capabilities • ASIS • Pulse-Coherent Sonars (RaDyO/SO GasEx) • Bubble-Size Distribution (Duck) • Ship-Based • WaMoS II (SO GasEx) • Scanning LIDAR (RaDyO) • Visible/Infrared Imaging (RaDyO/SO GasEx) • Polarimetric Imaging (RaDyO)
Amount of circular polarization Orientation and degree of linear polarization Intensity Polarimetry • Measures the polarization state of a bundle of light rays • Stokes parameters S = (S0, S1, S2, S3) • Each CCD camera measures a unique linear combination of the polarization state. • Mueller Calculus SOUT = M( ) SIN Incident Light Geometry and Material Properties of the Scattering Object Scattered Light Zappa, C. J., M. L. Banner, H. Schultz, A. Corrada-Emmanuel, L. B. Wolff, and J. Yalcin (2008), Retrieval of short ocean wave slope using polarimetric imaging, Measurement Science and Technology, 19(055503), doi:10.1088/0957-0233/1019/1085/055503.a
Polarimetric Slope Sensing (PSS) Stoke’s Vector PSS uses the change in polarization from scattering, reflection or refraction to infer the orientation of the interface. For negligible upwelling and for an unpolarized sky, the Degree of Linear Polarization is defined by or The Polarization Orientation is not affected by upwelling and is given by where The geometric relationship between the surface normal, incidence angle relative to the surface facet () and polarization orientation ().
Polarimeter Slope Topography Y- and X-component surface slope arrays computed from polarimetric images taken with the polarimeter during the RaDyO experiment in the Santa Barbara Channel from R/P Flip Sept. 2008. The scale shows the relationship between slope and grayscale. Image scale is 1 m by 1 m. U10 = 9.2 m s-1
Wave Height from Polarimeter Topography Image scale is 1 m by 1 m. U10 = 9.2 m s-1
Polarimeter Comparison with Scanning Lidar Investigation the source of the deviation is ongoing. Several factors could be responsible, including: Sky Polarization
Ring Waves from Rain Drops Slope in Degrees