Download
1 / 32
320 likes | 503 Vues
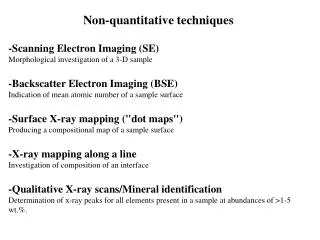
Non-quantitative techniques. -Scanning Electron Imaging (SE) Morphological investigation of a 3-D sample -Backscatter Electron Imaging (BSE) Indication of mean atomic number of a sample surface -Surface X-ray mapping ("dot maps") Producing a compositional map of a sample surface

E N D
Non-quantitative techniques -Scanning Electron Imaging (SE) Morphological investigation of a 3-D sample -Backscatter Electron Imaging (BSE) Indication of mean atomic number of a sample surface -Surface X-ray mapping ("dot maps") Producing a compositional map of a sample surface -X-ray mapping along a line Investigation of composition of an interface -Qualitative X-ray scans/Mineral identification Determination of x-ray peaks for all elements present in a sample at abundances of >1-5 wt.%.
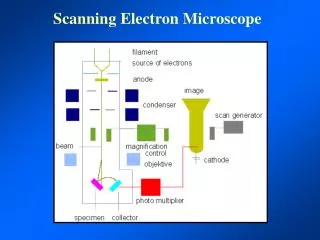
Scanning Images Includes SE/BSE/X-ray maps Produced by scanning the electron beam very rapidly over the surface of a sample, collecting, processing and displaying various types of signals. The scanning is accomplished using scanning coils in the lower part of the electron column. Advantages can include: -High spatial resolution (all types) -High depth of field (SE) -Large range of magnification (from 10-100,000x) (all types) -Simple sample preparation (for SE) Focusing the beam onto the sample using the final focusing lens is very important for this type of analysis, but optical focus of the sample is not, because quantitative collection of X-rays is not critical.
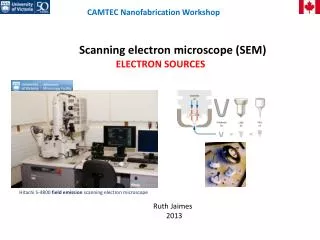
Secondary Electron Imaging Produced from low energy electrons emitted from near the sample surface. Some secondary electrons are produced by incident electrons as they enter the sample, but many are produced by emerging backscatter electrons. The production of SE is not strongly affected by Z, but because SE are generated to some level by BSE, different SE signals can be produced by different Z material. Secondary electron coefficient: ___# of SE produced____ # of electrons onto sample δ = for 10-30 keV accelerating voltage, the coefficient is 0.1-0.2
The coefficient of SE production is greater at greater incidence angle between the beam and sample. More SE are produced by a surface that is at an angle of greater than 90 degrees to the beam. This difference in production of electrons with surface angle gives rise to the 3-D appearance of SE images. The effect is similar to illuminating a sample surface partly with direct light, and partly with diffuse light. Edge effects are pronounce in SE imaging because of the greater production of electrons from an angled surface.
Spatial Resolution in SE imaging Secondary electrons have such low energy that they cannot escape from distances of less than 10 nm in solid material. SE are produced mainly from the very upper surface of the sample. Therefore, resolution using this technique is governed by the beam size. Highest resolution can be obtained by using the smallest possible beam. However, reducing the beam size also results in a loss of beam current, and therefore increase in "noisiness" of the image. The highest possibly magnification of an image is controlled by the maximum angle over which the electrons can be deflected without distortion, so is related to the distance between the sample and the detector.
Charging effects: Because SE have very low energy, they are strongly deflected by any charge buildup on the sample surface. So, a uniform coat is important.
Backscatter Electron Imaging Backscatter electrons are those that suffer high deflections and re-emerge from the sample surface. The fraction of electrons backscattered is called the "backscattering coefficient" and varies with the mean atomic number of the material analysed. This can be used to examine zoning in different phases, or to examine the relative proportions of phases in a sample. Powerful petrological tool because it is easier to distinguish some minerals based on Z than on optical properties.
BSE images contain compositional information, but nothing about specific elements. ONLY Z. However, BSE images are quicker to obtain than x-ray maps, and have better resolution. The Z resolution depends on mean Z of the sample. Because of their high energy, BSE electrons travel straight away from a sample surface and cannot be attracted in the same way as SE. So, detector configuration must be different. This could lead to shadowing problems. Six detectors are arranged in a circular pattern to avoid shadowing. The spatial resolution is much worse for BSE images than for SE images because many electrons come from deep within the sample. However, BSE image resolution can be improved by filtering out low energy electons.
Other image types: -Magnetic contrast: Can distinguish magnetic domaines in a mineral phase using SE image. Electrons are deflected by different magnetic domaines in a mineral. -Electron channelling In some orientations, BSE behave differently depending on the orientation of the mineral phase. Electrons may be "channelled" between atomic layers. Can be used to view crystalline orientations in fine grained samples. -Cathodoluminescence: Detection of visible light produced by electron impingement on a sample surface. Can be used to study growth zones. -Absorbed current image: Opposite of BSE. No shadow effects.
Factors that degrade scanning images: 1. Astigmatism: Distortion of the beam caused by dirt on the lense or aperture. Astigmatism of the beam results in an extremely fuzzy image that will not focus, even at low magnification. Astigmatism can be diagnosed by observing that the beam that will not focus in and out on a single point. Can be corrected using a "stigmator" control that electronically imposes astigmatim on the beam in order to cancel out the astigmatism caused by the dirty lense.
Beam poorly centered in aperture Results in extremely poor focus, and same focusing characteristics as astigmatism due to a dirty aperture. Can be solved by aligning the aperture while observing a point on the sample that is roughly round, and has a brightness contrast to the surrounding material (ie. a hole in the sample surface, or a speck of dust on a sample). High-resolution SE imaging is done with a 70 micron aperture in place of the normal 150 micron double aperture that is used for quantitative analysis. When these apertures are changed, they must be manually realigned in order to obtain good image focus.
Noise in scanning images Scanning images can be "noisy", showing random fluctuations in brightness from point to point, distracting the user's eye. There are two sources of noise: A. Statistical fluctuations in the number of detected electrons B. Noise in the electronic system The first can be addressed by using the highest possible beam current for the required resolution.
Image Collection Beam at 1 nanoamp Means 6*109 electrons/second onto the sample surface Of these 10-1 to 10-2 generate secondary electrons 500x500 image collected at 25 megahertz (cycles/second) 250,000 points on image each image collected in 1/25th or 0.04 seconds So, divide 0.04 seconds by 250,000 points per image So: 1.6 x 10⁻⁷ second, or 160 nanoseconds spent on each point 108 electrons/second generated 160 nanoseconds on each point so: 16 electrons/point are collected, on average
The faster the collection time of the image, the noisier it will be. So, to improve this problem, go to higher resolution and lower scan rate. This results in collection of more electrons or X-rays, resulting in a statistically more robust image. The down side of this is that focussing the image, or moving around, is difficult. Must go to higher scan speed for good focusing.
X-ray Maps X-ray, or "dot" maps can be made by setting spectrometers to an element of interest, then rastering the beam across the sample surface. This technique produces "dot" maps where each dot is representative of a photon produced by an X-ray of the element of interest. The longer an X-ray map is collected, the better the resolutions. Very high resolution X-ray maps may require hours of data collection time.
Qualitative X-ray analysis Produced line-maps across a sample for a single element, or can observe an entire X-ray spectrum of a single point on a sample surface. Can be produced either by energy-dispersive or wavelength-dispersive analysis. EDS- quick, and good for non-flat samples. Poor resolution. WDS- slower, but more precise. Flat samples only. Typically, K lines are observed, but for heavier elements, L and M lines may also be used. Mineral databases provide comparison for identification of phases.