Understanding Queuing Analysis: Optimizing Waiting Lines for Better Service Efficiency
190 likes | 301 Vues
Queuing analysis studies how individuals behave in lines to minimize waiting times and optimize resource allocation. Key elements include arrival rates (λ), representing the rate at which people join the queue, and service rates (μ), indicating the rate at which service is provided. This analysis often employs the single-server waiting line model, assuming a first-come, first-served approach with a Poisson arrival rate and exponential service times. By examining the relationship between λ and μ, businesses can make informed decisions to enhance customer experience and operational efficiency.

Understanding Queuing Analysis: Optimizing Waiting Lines for Better Service Efficiency
E N D
Presentation Transcript
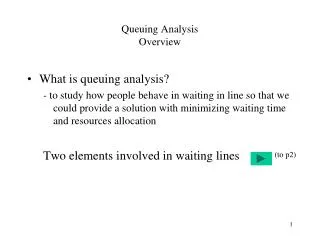
Queuing AnalysisOverview • What is queuing analysis? - to study how people behave in waiting in line so that we could provide a solution with minimizing waiting time and resources allocation Two elements involved in waiting lines (to p2)
Two elements involved in waiting lines • Arrival rate, • Rate of people joining to the queue • Service rate, • Rate of service that service provided How do they applied in a real life? (to p3)
Queuing Analysis Service rate, This phenomenon is known as Single-server Waiting Line How to study it? Arrival rate, (p9) (to p4)
The Single-Server Waiting Line SystemThe Single-Server Model We assumed that 1. An infinite calling population (that is many people can join the queue) 2. A first-come, first-served queue discipline 3. Poisson arrival rate 4. Exponential service times - Sympology: = the arrival rate (average number of arrivals per time period) = the service rate (average number served per time period) Again, we assumed that (< ) or we can never finish service customers before the end of the day! (to p5)
The relationship between and (to p18) • We adopted a “birth-and-death” process to study their relationship And we have the following results: P0 = Prob that no one in the queue Ls= number people waiting in the system Lq=number people waiting in the queue Ws= total waiting time in the system Wq= total waiting time in the queue How these L, W values are represented (to p6)
Busy time = Wq, Lq Idle time = P0 = 1 - Ws, Ls (to p7) Their relationships
The Single-Server Waiting Line SystemBasic Single-Server Queuing Formulas Probability that no customers are in the queuing system: Probability that n customers are in the system: Average number of customers in system: and waiting line: Average time customer spends waiting and being served: Average time customer spends waiting in the queue: Probability that server is busy (utilization factor): Probability that server is idle: Note: the process to derive these formulas are based on the “birth-and-death” process Example (to p8)
The Single-Server Waiting Line SystemOperating Characteristics for Fast Shop Market Example Example: Given: = 24 customers per hour arrive at checkout counter, = 30 customers per hour can be checked out = (1 - 24/30) = .20 probability of no customers in the system. = 24/(30 - 24) = 4 customers on ther average in the system = (24)2/[30(30 -24)] = 3.2 customers on the average in the waiting line = 1/[30 -24] = 0.167 hour (10 minutes) average time in the system per customer = 24/[30(30 -24)] = 0.133 hour (8 minutes) average time in the waiting line = 24/30 = .80 probability server busy, .20 probability server will be idle Then, (to p9)
The Single-Server Waiting Line System Steady-State Operating Characteristics Important note: Because of steady -state nature of operating characteristics: - Utilization factor, U, must be less than one: U<1,or / <1 and < . - The ratio of the arrival rate to the service rate must be less than one or, the service rate must be gretaer than the arrival rate. - The server must be able to serve customers faster than the arrival rate in the long run, or waiting line will grow to infinite size. What if Utilization rate >= 1? (what would happened?) Changing of the values of , . (to p10)
Consider another case where, • Manager wishes to test several alternatives for reducing customer waiting time: • 1. Addition of another employee to pack up purchases • 2. Addition of another checkout counter. • Which one of the three models that we should deploy? • Answer: • Comparing its operating characteristics • (all three examples with calculation) (to p11) (to p12) (to p13)
The Single-Server Waiting Line SystemEffect of Operating Characteristics on Managerial Decisions (1 of 3) - Alternative 1: Addition of an employee (raises service rate from = 30 to = 40 customers per hour) Cost $150 per week, avoids loss of $75 per week for each minute of reduced customer waiting time. System operating characteristics with new parameters: Po = .40 probability of no customers in the system L = 1.5 customers on the average in the queuing system Lq = 0.90 customer on the average in the waiting line W = 0.063 hour (3.75 minutes) average time in the system per customer Wq = 0.038 hour ( 2.25 minutes) average time in the waiting line per customer U = .60 probability that server is busy and customer must wait, .40 probability server available Average customer waiting time reduced from 8 to 2.25 minutes worth $431.25 per week. Net savings = $431.25 - 150 = $281.25 per week. = 1 - (24/40) i.e. (5.75*$75) (to p10)
The Single-Server Waiting Line SystemEffect of Operating Characteristics on Managerial Decisions (2 of 3) - Alternative 2: Addition of a new checkout counter ($6,000 plus $200 per week for additional cashier) =24/2 = 12 customers per hour per checkout counter. = 30 customers per hour at each counter System operating chacteristics with new parameters: Po = .60 probability of no customers in the system L = 0.67 customer in the queuing system Lq = 0.27 customer in the waiting line W = 0.055 hour (3.33 minutes) per customer in the system Wq = 0.022 hour (1.33 minutes) per customer in the waiting line U = .40 probability that a customer must wait I = .60 probability that server is idle and customer can be served. Savings from reduced waiting time worth $500 per week - $200 = $300 net savings per week. After $6,000 recovered, alternative 2 would provide $300 -281.25 = $18.75 more savings per week. (to p10)
The Single-Server Waiting Line SystemEffect of Operating Characteristics on Managerial Decisions (3 of 3) Table 13.1 Operating Characteristics for Each Alternative System Decision: very much depended on manager’s experience because there is difficult to obtain “the” best solution .. Figure 13.2 Cost trade-offs for service levels (to p14) Note: Min cost is not obtained here
One last note • The Single waiting line system we studied here can be denoted as: (to p15)
Models In this subject, we only consider the following model(s) only: (M/M/1):(GD/a/a) Infinite calling pop Possion arrival rate Infinite length Exponential service rate General queue discipline such as FCFS One service channel It has a general format like (to p16)
Type of models (A/B/C): (D/E/F) Size of population Arrival distribution Queue capacity, such max ppl in the queue length Service distribution Number of channels (parallel servers) Queue discipline, such as FCFS (to p17) Tutorial Questions
Tutorial Questions • Ex: 7, 8, 9 and 12 (END) End
The Single-Server Waiting Line SystemOperating Characteristics for Fast Shop Market Example Alternative 2 Example:1 Alternative 1 Given: = 24 = 24 = 24 /2=12 = 30 = 40 = 30 = (1 - 24/30) = .20 1-24/40 =0.4 1-12/30=0.6 = 24/(30 - 24) = 4 1.5 0.67 = (24)2/[30(30 -24)] = 3.2 0.9 0.27 = 1/[30 -24] = 0.167 hour (10 minutes) 0.063(3.75 mins) 0.055(3.33min) = 24/[30(30 -24)] = 0.133 hour (8 minutes) 0.038 (2.25 min) 0.022 (1.33 min) = 24/30 = .80 probability server busy, .20 0.6 0.4 Then, (to p9)