Long-Slit Spectra Reduction with IRAF
180 likes | 603 Vues
Long-Slit Spectra Reduction with IRAF. Arp 63. Fig.1: Galaxy + slit. Fig.2: Galaxy spectrum. l. Fig.3: Star spectrum. Bias subtraction. noao.imred.ccdred. zerocombine ccdproc / imarith. Frame - <bias>. Fig.4: Bias image. imstat

Long-Slit Spectra Reduction with IRAF
E N D
Presentation Transcript
Arp 63 Fig.1: Galaxy + slit Fig.2: Galaxy spectrum l Fig.3: Star spectrum
Bias subtraction noao.imred.ccdred • zerocombine • ccdproc / imarith Frame - <bias> Fig.4: Bias image imstat # IMAGE NPIX MEAN MIDPT STDDEV MIN MAX Zero 1036324 197.6 197.7 0.7823 193.7 201.5
Flat-field correction • noao.imred.ccdred • flatcombine • ccdproc / imarith Frame - <bias> ----------------- <flat> - <bias> Fig.5: Flat image imstat # IMAGE NPIX MEAN MIDPT STDDEV MIN MAX Flat 1036324 10913. 12410. 5605. 912.1 19706.
Flat-field normalization noao.twodspec.longslit • response Fig.6: Flat-field fitting along dispersion Fig.7: Normalized flat imstat # IMAGE NPIX MEAN MIDPT STDDEV MIN MAX nFlat 1036324 1. 0.996 0.03019 0.1302 1.135
Cosmic-rays removal • noao.imred.ccdred • cosmicrays • crutils • cosmicrays • crmedian Fig.8: Spectrum after bias and flat correction
L.A. Cosmics (Van Dokkum, 2001) Fig.10: Cosmic-rays mask Fig.9:Spectrum with cosmic-rays Fig.11: Cleaned image
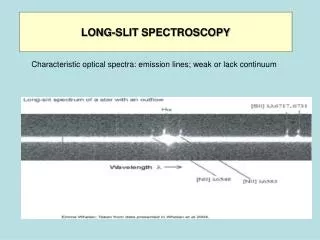
Wavelength calibration • noao.twodspec.longslit • identify • reidentify • fitcoords • transform Fig.12: Helium-Argon lamp spectrum
Fig.13: Spectral lines identification Fig.15: Bidimensional fit li = 4458.3 Å dl = 2.6 Å/px Fig.14: Fit residuals
Checking calibration Fig.17: After calibration Fig.16: Before calibration Fig.18: Night-sky [OI] lines
Flux calibration • noao.twodspec.apextract • apall • noao.onedspec • standard • sensfunc • noao.twodspec.longslit • calibrate Feige 56 Fig.19: Standard star spectrum
Fig.20: Star profile across dispersion Fig.21: Tracing along dispersion Fig.22: Extracted 1-D spectrum
Fig.23: Star fluxes measurement counts Fig.24: Calibration curve (upper) erg cm-2 sec-1 Å-1
Fig.25/26: Before and after flux calibration Frame ------------- calib. func. Fig.27: Calibrated spectrum (red)
Night-sky subtraction • noao.twodspec.longslit • background Fig.28: Fit of the sky across dispersion Fig.29: Spectrum after sky subtraction