Download
1 / 13
130 likes | 267 Vues
The Correlation of Spectral Lag Evolution with Prompt Optical Emission in GRB 080319B. Michael Stamatikos †. Center for Cosmology and Astro -Particle Physics (CCAPP) Fellow Department of Physics, The Ohio State University (OSU) Michael.Stamatikos-1@nasa.gov

E N D
The Correlation of Spectral Lag Evolution with Prompt Optical Emission in GRB 080319B Michael Stamatikos† Center for Cosmology and Astro-Particle Physics (CCAPP) Fellow Department of Physics, The Ohio State University (OSU) Michael.Stamatikos-1@nasa.gov †with T.N. Ukwatta, T. Sakamoto, K.S. Dhuga, D.L. Band, K. Toma, P. Mészáros, J.P. Norris… Frontiers of Space Astrophysics: Neutron Star & Gamma Ray Burst Conference Bibliotheca Alexandrina, Egypt April 4, 2009
Talk Overview • Spectral lag& utility in the context of GRBs I. Spectral Lag: II. Methodology: III. GRB 080319B: IV. Summary & Future Work: • Cross-Correlation Function (CCF) • Peak Function Fit • Time-Resolved vs. Time-Averaged Lag • Intrinsic Time-Resolved Spectral Lag (g-ray Band1:g-ray Band2) featuring Swift-BAT and Konus-Wind light curves • Extrinsic Time-Resolved Spectral lag (g-ray Band:optical Band) featuring Swift-BAT and TORTORA light curves • Time-resolved spectroscopy (Swift-BAT and Konus-Wind) • Is this ubiquitous or unique?
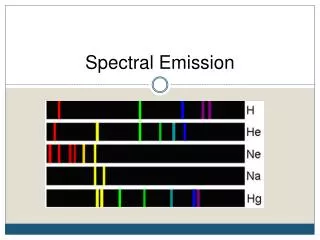
Spectral Lag’s Utility in the Context of GRBs Norris et al., ApJ 459: 393-412, (1996) Low Energy High Energy ½ • Temporal off-set (to) between photon pulses in low and high energy band passes = lag (tAB). • Pulse Fit Analysis: • Cross-Correlation Function (CCF): • Lag results in 3 cases: • Utilization: Lag-Luminosity Relation (red shift estimator), Short/Long GRB discriminator, etc. Norris, et al., ApJ 627, 324-345 (2005) Band, ApJ 486 928-937 (1997)
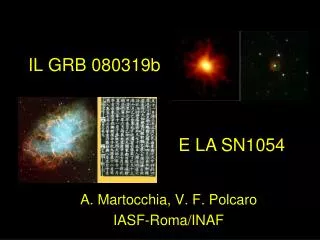
GRB 080319B Time-averaged spectral lag Stamatikos et al. arXiv:0902.0263.
Time-Resolved CCF Method: Spectral Lag Value ½ • Several parameters are required for analysis. Heuristic studies resulted in the following: • BATBINEVT was used to construct background subtracted 32 ms binned light curves for BAT canonical energy channels 1 (15-25 keV) and 3 (50-100 keV). • Cross-Correlation Function (CCF) based upon standard Pearson Correlation: • However, can choose between definition: • An investigation of the spectral evolution of the lag explores how lag changes as a function of time throughout a given burst segment. Hence, we are concerned with a time-resolved lag analysis rather than a traditional time-averaged result, i.e. over the entire burst duration. • Rigorous tests were performed in order to test the methodology on light curve pairs with known (artificial) lag. Our results showed that in order to avoid edge effects, which diminish/destroy the intrinsic lag, one must treat the signal as a stationary source for time-resolved study, i.e. one must subtract the mean. • Chen et al., ApJ 619, 983 (2005) and Hakkila et al., ApJ 677, 81 (2008) have demonstrated that lag variability is ubiquitous in GRB sub pulses, but require well behaved light curves. Band, ApJ 486 928-937 (1997) (Stationary source, mean subtraction) (Transient source, no mean subtraction)
Time-Resolved CCF Method: Spectral Lag Errors • Parameterization of spectral lag error based upon the height (h), half-width half-maximum (Wc), and the number of light curve bins (n), for a given CCF peak, such that : • To within a factor of unity, these errors agreed with a more traditional boot-strap method, where 1000 realizations of light curves were generated based upon: • In the above, IDL RANDOMN was used to generate the random number seed (x). • The peak of the CCF was fit to a Gaussian function, via MPFITPEAK: • Spectral lag error was based on numerical standard deviation of distribution of CCF peaks. • Primary MC Simulation: Optimizes CCF value per bin via providing CCF error bars. • Secondary MC Simulation: Optimizes CCF peak and simulates the data analysis. Correlation coefficients ranged from ~40%-90%, with typical values of ~60%. • Hence, the data determine the value of the spectral lag, but MC simulations give you the 1s error. Gaskell and Peterson ApJS 65 (1987)
Time-resolved spectral lag Stamatikos et al. arXiv:0902.0263.
Time-resolved spectral lag Stamatikos et al. arXiv:0902.0263.
Time-resolved spectral lag Stamatikos et al. arXiv:0902.0263.
Stamatikos et al. arXiv:0902.0263. *Margutti et al. arXiv:0809.0189.
GRB 080319B Racusin et al., Nature 455 (2008)
Conclusion/Future Outlook • Development of new method for time-resolved spectral lags. • Correlations between spectral lag and prompt optical emission in GRB 080319B confirms same emission region. • Need to increase sample size for more a detailed study. • If substantiated, this discovery would facilitate our understanding of the mechanism responsible for spectral lag and provide implicit connection to fireball shocks. • Future studies are promising, since Swift-Fermi synergy enables testing spectral lag evolution > 11 energy decades (UVOTLAT)! (See poster on BAT-GBM GRBs XCal)