Download
1 / 21
210 likes | 396 Vues
Forecasting Hurricane Storm Surge on the Mississippi River. David Reed Bob Stucky National Weather Service Lower Mississippi River Forecast Center. Today’s Talk. The Problem – Surges from Hurricanes Sea, Lake, and Overland Surge Heights (SLOSH Model)

E N D
Forecasting Hurricane Storm Surge on the Mississippi River David Reed Bob Stucky National Weather Service Lower Mississippi River Forecast Center
Today’s Talk • The Problem – Surges from Hurricanes • Sea, Lake, and Overland Surge Heights (SLOSH Model) • Dynamic Wave Operational Model (DWOPER) • Merging These Together to Forecast River Surges Hurricane Betsy – September 11, 1965 (Mississippi River - Louisiana)
Hurricane Storm Surge The Problem • Hurricanes can cause the Mississippi River to rise rapidly due to Storm Surge • Ships can be grounded or swamped due to these rapid rises Hurricane Betsy – September 11, 1965 (Mississippi River – Louisiana)
Hurricane Storm Surge – The Problem • Flood gates and loading docks must be closed which takes time to complete Hurricane Betsy – September 11, 1965
SLOSH Model • Sea, Lake, and Overland Surge Heights (SLOSH Model) • Forecasted storm surge from hurricanes based on • Forward Speed • Intensity • Track • Size
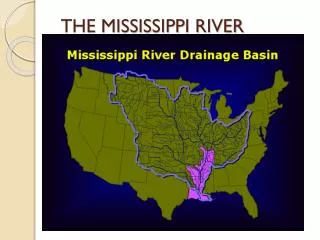
SLOSH Model – Cont’d • SLOSH can be run for 35 grids/basins along the Gulf or Atlantic Coasts • Each basin grid is a continuously changing polar grid • Lake Pontchartrain basin used in our analysis Lake Ponchartrain Basin (outlined in white)
SLOSH Model – Cont’d • Higher resolution inland • Contains topography and levees which is periodically updated
SLOSH Model • Model is run about 24 hours prior to landfall based on TPC forecast • Output provided to NWS offices in a binary file • SLOSH Display program allows for animation of output from SLOSH • Local software determines hydrograph at West Pointe a la Hache where continuous levees begin along the Mississippi River
DWOPER • NWS Dynamic Wave Operational Model (DWOPER) • One-dimensional unsteady state flow model • LMRFC has DWOPER setup to run on the Lower Ohio/Mississippi Rivers to the Gulf of Mexico
For storm surge, run model from Red River Landing, LA, to West Pointe a la Hache, LA West Pointe a la Hache – start of continuous levees along both sides of the Mississippi River Upstream boundary Stream flow at Red River Landing Downstream boundary Forecasted storm surge hydrograph (stage) at West Pointe a la Hache DWOPER – Cont’d
Lower Mississippi River Dynamic Wave Operational (DWOPER) Model Red River Landing to West Pointe a la Hache RM 302.4 to RM 48.7
Merging SLOSH Output with DWOPER • Within 24 hours of landfall, SLOSH model runs produce a forecasted surge hydrograph (stage) at West Pointe a la Hache • LMRFC uses the SLOSH forecasted surge at West Pointe a la Hache as the DWOPER downstream boundary condition • DWOPER models the surge wave as it propagates upstream • Flood wave fully contained within levee system with no lateral inflows or outflows
Merging SLOSH Output with DWOPER • LMRFC issues stage forecasts with crests on the Mississippi River at and below Red River Landing • NWS field offices may issue river warnings or include other river information in Hurricane Local Statements
forecast 24 hours prior to landfall SLOSH runs provide forecasted stage heights at West Pointe ala Hache Hurricane Georges 1998Location 24 hours prior to landfall observed track - black boxes forecasted track- white boxes
Hurricane Georges SurgeSeptember 1998Mississippi River at West Pointe a la Hache, LA
Hurricane Georges SurgeSeptember 1998Mississippi River at New Orleans, LA
Hurricane Georges SurgeSeptember 1998Mississippi River at Baton Rouge, LA
Real-time River ForecastsHurricane Georges’ Surge RIVER FORECAST…LOWER OHIO/MISSISSIPPI RIVER LOWER MISSISSIPPI RIVER FORECAST CENTER NATIONAL WEATHER SERVICE SLIDELL LA 1020AM CDT SUN SEP 27 1998 STATION FS 7AM 24HR ……F O R E C A S T…… STG CHG 0928 0929 0930 1001 1002 CREST/DATE/TIME MISSISSIPPI RIVER …OBSERVED... RED RIVER LANDING 48 20.4 +1.1 21.9 21.4 20.9 20.9 20.7 22.5 9/28 7 PM CDT 21.80 9/28 2PM CDT BATON ROUGE 35 7.5 MSG 12.3 9.4 8.9 8.5 8.4 13.0 9/28 9AM CDT 12.19 9/28 5AM CDT DONALDSONVILLE 27 5.5 +0.9 12.0 7.1 6.8 6.4 6.4 12.0 9/28 7AM CDT MSG RESERVE 22 4.8 +0.9 11.0 6.0 5.8 5.7 5.7 11.2 9/28 6AM CDT 10.35 9/28 1AM CDT NEW ORLEANS 17 4.5 +1.1 10.2 5.8 5.6 5.5 5.5 10.8 9/28 4AM CDT 10.16 9/27 10PM CDT FS = FLOOD STAGE IN FEET NGVD STG = STAGE IN FEET NGVD MSG = MISSING NOTE: All NWS river forecasts are issued to the public in English units
Summary - Conclusions • Ability to merge the SLOSH model output with land-based dynamic river models • Produces excellent river surge forecasts when SLOSH predicted surge hydrographs are reasonable • Hurricane induced river surges propagate rapidly upstream • Provides valuable river surge information for shipping/barge industry and for flood gate management • Concept should be applied to smaller coastal rivers and streams