Download
1 / 1
10 likes | 170 Vues
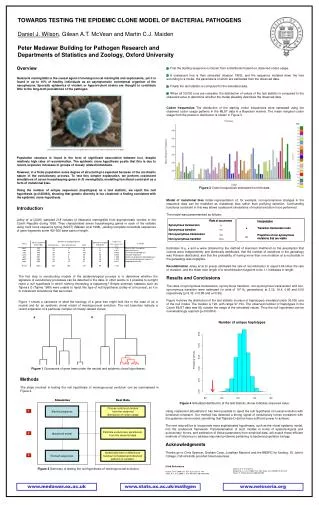
TOWARDS TESTING THE EPIDEMIC CLONE MODEL OF BACTERIAL PATHOGENS Daniel J. Wilson , Gilean A.T. McVean and Martin C.J. Maiden Peter Medawar Building for Pathogen Research and Departments of Statistics and Zoology, Oxford University. Overview

E N D
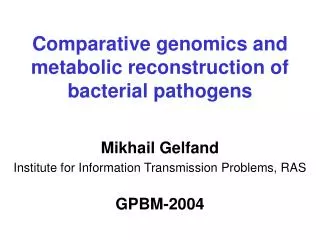
TOWARDS TESTING THE EPIDEMIC CLONE MODEL OF BACTERIAL PATHOGENS Daniel J. Wilson, Gilean A.T. McVean and Martin C.J. Maiden Peter Medawar Building for Pathogen Research and Departments of Statistics and Zoology, Oxford University Overview Neisseria meningitidis is the causal agent of meningococcal meningitis and septicaemia, yet it is found in up to 10% of healthy individuals as an asymptomatic commensal organism of the nasopharynx. Sporadic epidemics of virulent or hypervirulent strains are thought to contribute little to the long-term persistence of the pathogen. • First the starting sequence is chosen from a distribution based on observed codon usage. • A coalescent tree is then simulated (Hudson 1990), and the sequence mutated down the tree according to a model, the parameters of which are estimated from the observed data. • Finally the test statistic is computed for the simulated data. • When all 30,000 runs are complete, the distribution of values of the test statistic is compared to the observed value to determine whether the model plausibly describes the observed data. • Codon frequencies The distribution of the starting codon frequencies were estimated using the observed codon usage patterns in the MLST data in a Bayesian manner. The mean marginal codon usage from the posterior distribution is shown in Figure 3. Simulation Real Data Starting sequence Choose codons at random from the observed distribution of codon usage 1 Mutational model Estimate evolutionary parameters from the observed data 2 Evolved sequences Statistically test for differences between simulated and observedpatterns of variation. 3 Scanning electron micrograph of Neisseria meningitidis taken from http://www.sanger.ac.uk/Projects/N_meningitidis/ Population structure is found in the form of significant association between loci, despite relatively high rates of recombination. The epidemic clone hypothesis posits that this is due to recent, explosive increases in groups of closely related individuals. However, in a finite population some degree of structuring is expected because of the stochastic nature of the evolutionary process. To test this simpler explanation, we perform coalescent simulations of seven housekeeping genes in N. meningitidis, modelling functional constraint as a form of mutational bias. Using the number of unique sequences (haplotypes) as a test statistic, we reject the null hypothesis (p<0.00004), showing that genetic diversity is too clustered: a finding consistent with the epidemic clone hypothesis. Introduction Jolley et al (2000) sampled 218 isolates of Neisseria meningitidis from asymptomatic carriers in the Czech Republic during 1993. They characterised seven housekeeping genes in each of the isolates using multi locus sequence typing (MLST) (Maiden et al 1998), yielding complete nucleotide sequences of gene fragments some 400-500 base pairs in length. Figure 3 Codon frequencies estimated from the data. Model of mutational bias Under-representation of, for example, non-synonymous changes in the sequence data can be modelled as mutational bias rather than purifying selection. Confounding functional constraint in this way allows coalescent simulations of neutral evolution to be performed. The model was parameterised as follows: Estimates of μ, κ and ω were obtained by the method of maximum likelihood on the assumption that codons were independently and identically distributed, that the number of mutations in the genealogy was Poisson distributed, and that the probability of having more than one mutation at a nucleotide in the genealogy was negligible. Recombination Jolley et al (in press) estimated the rate of recombination to equal 0.94 times the rate of mutation, and the mean tract length of a recombination fragment to be 1.1 kilobases in length. Results and Conclusions The rates of synonymous transversion, synonymous transition, non-synonymous transversion and non-synonymous transition were estimated (in units of 103 Ne generations) at 3.32, 19.4, 0.86 and 5.06 respectively (μ=3.32, κ=5.85 and ω=0.26). Figure 4 shows the distribution of the test statistic (number of haplotypes) simulated under 30,000 runs of the null model. The median is 126, with range 97-154. The observed number of haplotypes in the Czech MLST data was 89, outside the range of the simulated values. Thus the null hypothesis can be overwhelmingly rejected (p<0.00004). The first step in constructing models of the epidemiological process is to determine whether the signature of evolutionary processes can be detected in the data. In other words, is it possible to outright reject a null hypothesis in which nothing interesting is happening? Simple summary statistics such as Tajima’s D (Tajima 1989) were unable to reject this type of null hypothesis (Jolley et al in press), so it is to coalescent simulations that we turned. Figure 1 shows a caricature of what the topology of a gene tree might look like in the case of (a) a neutral and (b) an epidemic clonal model of meningococcal evolution. The red branches indicate a recent expansion of a particular complex of closely-related clones. Figure 1 Caricatures of gene trees under the neutral and epidemic clonal hypotheses. Methods The steps involved in testing the null hypothesis of meningococcal evolution can be summarised in Figure 2. a b Using coalescent simulations it has been possible to reject the null hypothesis of neutral evolution with functional constraint. Our method has detected a strong signal of evolutionary forces consistent with the epidemic clone model, something that Tajima’s D did not have sufficient power to achieve. The next step will be to incorporate more sophisticated hypotheses, such as the clonal epidemic model, into the coalescent framework. Parameterisation of such models in terms of epidemiological and evolutionary forces, and estimation of those parameters from empirical data, will exploit these efficient methods of inference to address important problems pertaining to bacterial population biology. Acknowledgments Thanks go to Chris Spencer, Graham Coop, Jonathan Marchini and the BBSRC for funding. St. John’s College, Oxford kindly provided travel expenses. Cited References Hudson, R.R. (1990) Oxf. Surv. Evol. Biol.7: 1-44 Jolley, K.A. et al (2000) J. Clin. Microbiol.38: 4492-4498 Figure 4 Simulated distribution of the test statistic. Arrow indicates observed value. Figure 2 Summary of testing the null hypothesis of meningococcal evolution. Jolley, K.A. et al (in press) Maiden, M.C.J. et al (1998) Proc. Natl. Acad. Sci. USA95: 3140-3145 Tajima, F. (1989) Genetics123: 585-595 www.medawar.ox.ac.uk www.stats.ox.ac.uk/mathgen www.neisseria.org