Download
1 / 27
270 likes | 479 Vues
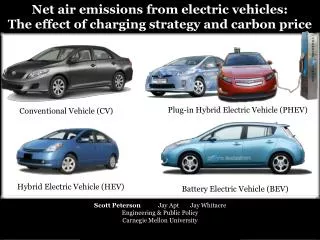
Net air emissions from electric vehicles: The effect of charging strategy and carbon price. Plug-in Hybrid Electric Vehicle (PHEV). Conventional Vehicle (CV). Hybrid Electric Vehicle (HEV). Battery Electric Vehicle (BEV). Scott Peterson Jay Apt Jay Whitacre

E N D
Net air emissions from electric vehicles: The effect of charging strategy and carbon price Plug-in Hybrid Electric Vehicle (PHEV) Conventional Vehicle (CV) Hybrid Electric Vehicle (HEV) Battery Electric Vehicle (BEV) Scott Peterson Jay Apt Jay Whitacre Engineering & Public PolicyCarnegie Mellon University
Net air emissions from electric vehicles: The effect of charging strategy and carbon price Plug-in Hybrid Electric Vehicle (PHEV) Conventional Vehicle (CV) Hybrid Electric Vehicle (HEV) Battery Electric Vehicle (BEV) Scott Peterson Jay Apt Jay Whitacre Engineering & Public PolicyCarnegie Mellon University
Preview of results • CO2 and NOX emissions decline • SO2 heavily dependent on future regulations • Carbon price on electricity alone will not reduce emissions unless it is high enough to encourage carbon capture
Model assumptions - Grid • Modeled PJM and NYISO two ISOs in NE US both in 2005
Model assumptions - Grid • Modeled PJM and NYISO • Used eGRID2005 database and cost and quality of fuels to estimate short run marginal cost and emissions
Model assumptions - Grid • Modeled PJM and NYISO • Used eGRID database and cost and quality of fuels to estimate short run marginal cost and emissions • Added $50/tonne CO2tax • -0.1 price elasticity of demand for no-PHEV load • Consumers do not change PHEV demand because electricity is cheap compared to gasoline
Model assumptions - Grid • Modeled PJM and NYISO • Used eGRID database and cost and quality of fuels to estimate short run marginal cost and emissions • Added $50/tonne CO2tax • Modeled CCS on coal plants by de-rating capacity 20% and lowering CO2 emissions 80% • SO2 decreases below 10 ppm • Little change in NOX
Short run marginal cost curves PJM • Load combined with SRMC curve to determine plants used Peterson, S.B., J.F. Whitacre, and J. Apt, Net Air Emissions from Electric Vehicles: The Effect of Carbon Price and Charging Strategies, Environmental Science & Technology, 2011, 45(5): 1792-1797.
Model assumptions - Grid • Modeled PJM and NYISO • Used eGRID database and cost and quality of fuels to estimate short run marginal cost and emissions • Added $50/tonne CO2tax • Modeled CCS on coal plants • No congestion (a plant anywhere in PJM can meet load anywhere in PJM)
Model assumptions - Grid • Modeled PJM and NYISO • Used eGRID database and cost and quality of fuels to estimate short run marginal cost and emissions • Added $50/tonne CO2tax • Modeled CCS on coal plants • No congestion • No imports and exports modeled • No accounting for ramp up and down in wind case • Natural gas case assumed 45% efficiency
Model assumptions - Vehicles • Only focus on use phase • Majeau-Bettez et al. found quite different upstream emissions than previously reported (2-3x increase)
Model assumptions - Vehicles • Only focus on use phase • Driving patterns from national household travel survey (NHTS). Lists trips taken by household members
Model assumptions - Vehicles • Only focus on use phase • Driving patterns from NHTS • No change in fleet (same proportion of cars, vans, SUVs, trucks)
Model assumptions - Vehicles • Only focus on use phase • Driving patterns from NHTS • No change in fleet • Charge depleting (CD) and Charge sustaining (CS) efficiency and usable battery size
Model assumptions - Vehicles • Only focus on use phase • Driving patterns from NHTS • No change in fleet • CD, CS efficiency and battery size • Three charging strategies • Home – Vehicle charges one time after last trip of day • Smart – Vehicle charges one time during low load • Work – Vehicle charges two times, once at work and once after last trip of the day
Example load curves with 50% PHEVs Load on day of maximum hourly demand (Tuesday, July 26, 2005) in PJM, 50% PHEVs with (a) small batteries and (b) large batteries Peterson, S.B., J.F. Whitacre, and J. Apt, Net Air Emissions from Electric Vehicles: The Effect of Carbon Price and Charging Strategies, Environmental Science & Technology, 2011, 45(5): 1792-1797.
Model assumptions - Vehicles • Only focus on use phase • Driving patterns from NHTS • No change in fleet • CD, CS efficiency and battery size • Three charging strategies (Home, Work, Smart) • Charge rate 7.2kW
Charge rate only matters for large batteries Work and Home Charge Home only Charge Load per PHEV driven given work charging for (a) small batteries on a weekday, (b) small batteries on a weekend, (c) large batteries on a weekday, (d) large batteries on a weekend. Peterson, S.B., J.F. Whitacre, and J. Apt, Net Air Emissions from Electric Vehicles: The Effect of Carbon Price and Charging Strategies, Environmental Science & Technology, 2011, 45(5): 1792-1797.
Model assumptions - Vehicles • Only focus on use phase • Driving patterns from NHTS • No change in fleet • CD, CS efficiency and battery size • Three charging strategies (Home, Work, Smart) • Charge rate 7.2kW • 10% PHEV results shown
SO2 emissions far lower with CATR • SO2 emissions likely increase, but if US clean air transport rule is implemented the change will be much smaller, or negative if operating at cap
Take away • PHEVs will lead to decreases in CO2 and NOX emissions compared to conventional vehicles • A carbon price only on electricity will not lead to decreases in CO2 or other emissions • Future regulation such as the proposed clean air transport rule will determine SO2 emissions
Acknowledgements • Co-authors • Prof. Jay Apt (CMU)Tepper School of Business & Engineering& Public Policy • Prof. Jay Whitacre (CMU)Material Science & EngineeringEngineering & Public Policy • Carnegie Mellon • Vehicle Electrification Group • Support • Carnegie Mellon Philip and Marsha Dowd Engineering Seed Fund • Toyota Motor Corp