Listeria Biofilm Formation Under Various Conditions
150 likes | 173 Vues
Absorbance study of Listeria monocytogenes biofilms in TSBYE with altered conditions at different temperatures using a microplate assay.

Listeria Biofilm Formation Under Various Conditions
E N D
Presentation Transcript
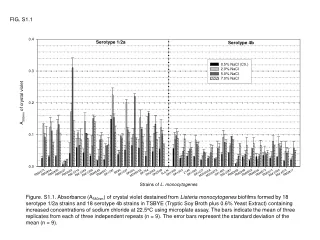
FIG. S1.1 Figure. S1.1. Absorbance (A580nm) of crystal violet destained from Listeria monocytogenes biofilms formed by 18 serotype 1/2a strains and 18 serotype 4b strains in TSBYE (Tryptic Soy Broth plus 0.6% Yeast Extract) containing increased concentrations of sodium chloride at 22.5oC using microplate assay. The bars indicate the mean of three replicates from each of three independent repeats (n = 9). The error bars represent the standard deviation of the mean (n = 9).
FIG. S1.2 Figure. S1.2. Absorbance (A580nm) of crystal violet destained from Listeria monocytogenes biofilms formed by 18 serotype 1/2a strains and 18 serotype 4b strains in TSBTE (Tryptic Soy Broth plus 0.6% Yeast Extract) containing increased concentrations of sodium chloride at 30oC using microplate assay. The bars indicate the mean of three replicates from each of three independent repeats (n = 9). The error bars represent the standard deviation of the mean (n = 9).
FIG. S1.3 Figure. S1.3. Absorbance (A580nm) of crystal violet destained from Listeria monocytogenes biofilms formed by 18 serotype 1/2a strains and 18 serotype 4b strains in TSBYE (Tryptic Soy Broth plus 0.6% Yeast Extract) containing increased concentrations of sodium chloride at 37oC using microplate assay. The bars indicate the mean of three replicates from each of three independent repeats (n = 9). The error bars represent the standard deviation of the mean (n = 9).
FIG. S2.1 Figure. S2.1. Absorbance (A580nm) of crystal violet destained from Listeria monocytogenes biofilms formed by 18 serotype 1/2a strains and 18 serotype 4b strains in TSBYE (Tryptic Soy Broth plus 0.6% Yeast Extract) containing increased concentrations of glucose at 22.5oC using microplate assay. The bars indicate the mean of three replicates from each of three independent repeats (n = 9). The error bars represent the standard deviation of the mean (n = 9).
FIG. S2.2 Figure. S2.2. Absorbance (A580nm) of crystal violet destained from Listeria monocytogenes biofilms formed by 18 serotype 1/2a strains and 18 serotype 4b strains in TSBYE (Tryptic Soy Broth plus 0.6% Yeast Extract) containing increased concentrations of glucose at 30oC using microplate assay. The bars indicate the mean of three replicates from each of three independent repeats (n = 9). The error bars represent the standard deviation of the mean (n = 9).
FIG. S2.3 Figure. S2.3. Absorbance (A580nm) of crystal violet destained from Listeria monocytogenes biofilms formed by 18 serotype 1/2a strains and 18 serotype 4b strains in TSBYE (Tryptic Soy Broth plus 0.6% Yeast Extract) containing increased concentrations of glucose at 37oC using microplate assay. The bars indicate the mean of three replicates from each of three independent repeats (n = 9). The error bars represent the standard deviation of the mean (n = 9).
FIG. S3.1 Figure. S3.1. Absorbance (A580nm) of crystal violet destained from Listeria monocytogenes biofilms formed by 18 serotype 1/2a strains and 18 serotype 4b strains in TSBYE (Tryptic Soy Broth plus 0.6% Yeast Extract) containing increased concentrations of ethanol at 22.5oC using microplate assay. The bars indicate the mean of three replicates from each of three independent repeats (n = 9). The error bars represent the standard deviation of the mean (n = 9).
FIG. S3.2 Figure. S3.2. Absorbance (A580nm) of crystal violet destained from Listeria monocytogenes biofilms formed by 18 serotype 1/2a strains and 18 serotype 4b strains in TSBYE (Tryptic Soy Broth plus 0.6% Yeast Extract) containing increased concentrations of ethanol at 30oC using microplate assay. The bars indicate the mean of three replicates from each of three independent repeats (n = 9). The error bars represent the standard deviation of the mean (n = 9).
FIG. S3.3 Figure S3.3. Absorbance (A580nm) of crystal violet destained from Listeria monocytogenes biofilms formed by 18 serotype 1/2a strains and 18 serotype 4b strains in TSBYE (Tryptic Soy Broth plus 0.6% Yeast Extract) containing increased concentrations of ethanol at 37oC using microplate assay. The bars indicate the mean of three replicates from each of three independent repeats (n = 9). The error bars represent the standard deviation of the mean (n = 9).
FIG. S4.1 Figure S4.1. Absorbance (A580nm) of crystal violet destained from Listeria monocytogenes biofilms formed by 18 serotype 1/2a strains and 18 serotype 4b strains in TSBYE (Tryptic Soy Broth plus 0.6% Yeast Extract) containing 1.0% of glucose, or 2% of sodium chloride, or the combination of both at 22.5oC using microplate assay. The bars indicate the mean of three replicates from each of three independent repeats (n = 9). The error bars represent the standard deviation of the mean (n = 9).
FIG. S4.2 Figure S4.2. Absorbance (A580nm) of crystal violet destained from Listeria monocytogenes biofilms formed by 18 serotype 1/2a strains and 18 serotype 4b strains in TSBYE (Tryptic Soy Broth plus 0.6% Yeast Extract) containing 1.0% of glucose, or 2% of sodium chloride, or the combination of both at 30oC using microplate assay. The bars indicate the mean of three replicates from each of three independent repeats (n = 9). The error bars represent the standard deviation of the mean (n = 9).
FIG. S4.3 Figure S4.3. Absorbance (A580nm) of crystal violet destained from Listeria monocytogenes biofilms formed by 18 serotype 1/2a strains and 18 serotype 4b strains in TSBYE (Tryptic Soy Broth plus 0.6% Yeast Extract) containing 1.0% of glucose, or 2% of sodium chloride, or the combination of both at 37oC using microplate assay. The bars indicate the mean of three replicates from each of three independent repeats (n = 9). The error bars represent the standard deviation of the mean (n = 9).
FIG. S5.1 Figure S5.1. Maximum growth rate (h-1) of L. monocytogenes in TSBYE (Tryptic Soy Broth plus 0.6% Yeast Extract) supplemented with extra glucose (1.0%), or sodium chloride (2.0%), or both at 22.5oC. The bars indicate the mean of three replicates from each of three independent repeats (n = 9). The error bars represent the standard deviation of the mean (n = 9).
FIG. S5.2 Figure S5.2. Maximum growth rate (h-1) of L. monocytogenes in TSBYE (Tryptic Soy Broth plus 0.6% Yeast Extract) supplemented with extra glucose (1.0%), or sodium chloride (2.0%), or both at 30oC. The bars indicate the mean of three replicates from each of three independent repeats (n = 9). The error bars represent the standard deviation of the mean (n = 9).
FIG. S5.3 Figure S5.3. Maximum growth rate (h-1) of L. monocytogenes in TSBYE (Tryptic Soy Broth plus 0.6% Yeast Extract) supplemented with extra glucose (1.0%), or sodium chloride (2.0%), or both at 37oC. The bars indicate the mean of three replicates from each of three independent repeats (n = 9). The error bars represent the standard deviation of the mean (n = 9).