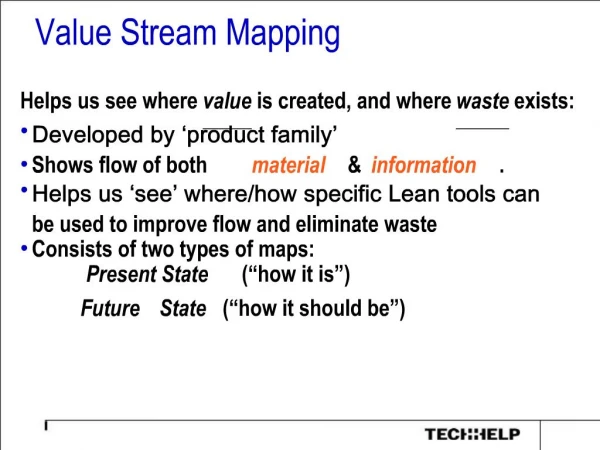
Value Stream Mapping
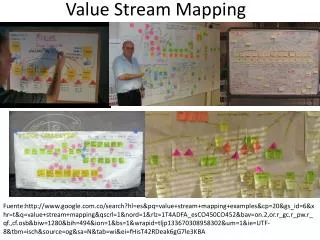
Value Stream Mapping. Quick Start. Defining A Value Stream. A series of steps that must be performed in the proper sequence to create value for a customer The complete value stream includes information flow and product or material flow


Value Stream Mapping
E N D
Presentation Transcript
Value Stream Mapping Quick Start
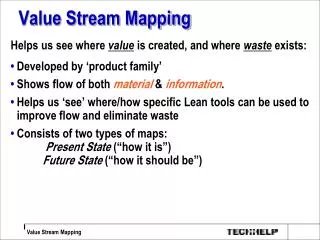
Defining A Value Stream • A series of steps that must be performed in the proper sequence to create value for a customer • The complete value stream includes information flow and product or material flow • The value stream includes all steps; value-added and non value-added If there is a product, service or process for a customer, there is a value stream.
Why Value Stream Map? • Helps you visualize more than just the process level • Allows you to see the sources of waste • Define key leverage points for improvements • Displays linkage between information and material flow • Admin processes may show linkage between information flow and the actions that result from the information flow VSM creates a common understanding of reality and the improvement possibilities.
Value Stream Levels Process Level Facility Level (Cell or Department) Extended Value Stream Multiple Facilities: (Includes Suppliers & Customers) Choose the level appropriate for your scope.
The VSM Process Overview • Current State • Identify key process steps for delivering product/service to customer • Utilize information from “go see” (Gemba) or interviews • Include key metrics with each step • Include lead time and cycle time data • Identify Undesirable Observations (UDO’s) • Determine data gaps that need to be collected • Identify flow of information from end customer to beginning of process • Include systems that provide information • Record the frequency and type of information • If information is your “product” you can identify origin of information • Determine if the Value Stream steps are VA or NVA • Analyze wastes and determine improvements • Develop action plan to make improvements
7 Steps to Utilizing a Value Stream Map • Identify scope of the Value Stream Map • Identify VSM team lead and participants • Organize and conduct a tour of area to “go see” • Map the high level process and gather key data • Identify the value stream (product/process alignment and the critical path) • Create the Current State Value Stream Map • Material Flow • Information Flow • VA/ NVA classification • Identify the Waste • Identify areas of opportunities for improvement • Develop an Action Plan to make the improvements
Step 3: “Go See” the Product/Service If the process is visible: • Process map at high level • Walk the process and record individual process steps, UDOs*, cycle time, distance, # of people, quality, etc. • Ask operators questions • Note metrics, materials, machines, WIP**, finished goods If the process is not visible: • Create detailed process map • Include UDOs, cycle time, distance, # of people, quality, etc. • Provide process map to all operators • Interview employees involved in process • Analyze portions of process which are visible • Utilize VOC surveys to collect key data points • Validate findings with operators *UDO (Undesirable Observation) – any observation about the process that is not ideal **WIP (Work In Process inventory) – inventory that is contained in the process
Gather Info Approval Meeting Step 4: Map the High-Level Process Example: Generating an estimate for a customer 2 days between processes 30 minute cycle time 6 people involved Analyze Info Develop work-up Input data into file Collect Sub-quotes Prepare Estimate WIP On-Line Tool Input Boundary Output Boundary • Having 4 to 10 process steps is common • Review the scope if you have more or less • Consolidate detailed process steps into higher level value stream steps • Determine key data to collect, WIP, Distance, Time, # of people, quality, etc. • Capture any variation within the process
Gather Info Approval Meeting Analyze Info Develop Takeoff Input data into file Collect Sub-quotes Prepare Estimate Step 4: Identify Key Data Elements Example: Generating an estimate for a customer Cycle Time: 4 hrs 24 hrs 2 hrs 2 hrs Wait Time: 48 hrs 24 hrs 8 hrs 8 hrs # of People: 1 2 1 1 2 6 Transport: Manual Phone E-mail E-Mail WIP: 2 2 4 3 3 Who: Ops Sales/Ops Sales/Ops Sales Sales Missing data to be collected prior to VSM • If data not available, use averages based on operators assessment • Check old records, files, reports, etc. • Additional data collection by surveys/interviews • Finalize data during the “Identify Materials Flow” step
Step 5: Identify the Value Stream • Determine critical path and area for improvement “Whenever there is a product for a customer, there is a value stream. The challenge lies in seeing it.” Learning to See by Rother and Shook
Value Stream Map –Operationalexample DOWNTIME 15% MELT 903M INSP CHEM Hold Furnace Cast 903 REC STAGE WIP 870 QTIME 72H WIP 696 QTIME P/T 6N LOT 75K P/T 8H WIP 8 COILS 120K P/T 3 HR 15K WIP 8 6 8 3 DOWNTIME 15.5% STORE STAGE INSP PROFILE BREAKDOWN 911 LEAD 2231.1 VA 210.1 WIP 746K QTIME 8 1OK WIP 108K 8HR Q/T 8 7% SCRAP LOT 1 COIL TIME .1 WIP 15K • Map major process steps • I.D. Value (green/ yellow) / Non-value (red) • Capture all times, quantities • Prioritize areas to improve X SHIPPED PER DAY 850K 1.870 WIP BEING WORKED 4.276 WIP BEING STORED
Step 6: Create the Current State VSM • Map the Material Flow • Map the Information Flow • Classify VA and NVA activities
First in First out control Information I People required Things pulled by next process Inventory Pieces Electronic Information Things pushed to next process Waiting Transport Input- Basket Pull system Paper trigger FIFO max 10 Pull system Returnable container In Output- Basket Out VSM Symbols
Gather Info Approval Meeting Analyze Info Develop Takeoff Input data into file Collect Sub-quotes Prepare Estimate Step 6: Map the Materials Flow No Process Too many people No standard work Cycle Time: 4 hrs 8 hrs 24 hrs 2 hrs 2 hrs 2 hrs 4 hrs Wait Time: 8 hrs 48 hrs 8 hrs 24 hrs 8 hrs 8 hrs # of People: 1 2 1 1 2 2 6 Transport: Manual Manual E-mail Phone E-mail E-Mail WIP: 2 2 4 1 3 2 3 Who: Sales Ops Sales/Ops Sales/Ops Sales/Ops Sales Sales • Come to agreement on process steps as a team • Include all key data for each process step • Include UDOs • Material flows from left to right UDO Push
Step 6: Map the Information Flow Sales Funnel Database Sales Leader 1-5 days 75 Estimates per month 1-2 days 1-30 days Sales Representative Estimator 2-5 days • Information should flow right to left, always starting with customer • Cycle times can be averages or ranges • The more detail you include, the more waste you will see
Step 6: Identify VA & NVA Sales Funnel Database Sales Leader 1-5 days 75 Estimates per month 1-30 days 1-2 days Sales Representative Estimator 2-5 days No Process Too many people No standard work Gather Info Analyze Info Develop Takeoff Input data into file Collect Sub-quotes Prepare Estimate Approval Meeting 4 hrs 8 hrs 24 hrs 2 hrs 4 hrs 2 hrs 2 hrs 8 hrs 48 hrs 8 hrs 24 hrs 8 hrs 8 hrs # of People: 1 2 1 1 2 2 6 Transport: Manual Manual E-mail Phone E-mail E-Mail WIP: 2 2 4 1 3 2 3 Who: Sales Ops Sales/Ops Sales/Ops Sales/Ops Sales Sales VA/NVA VA NVA VA NVA NVA NVA NVA • Customer cares • Changes form, fit or function • Correct Remember the 3 C's
Step 7: Use the VSM to Identify Waste • Identify areas of opportunities for improvement • Develop an action plan to make the improvements
Step 7: Use the VSM to Identify Waste Sales Funnel Database Sales Leader 1-5 days 75 Estimates per month 1-30 days 1-2 days Sales Representative Estimator 2-5 days No standard work No Process Too many people Gather Info Analyze Info Develop work-up Input data into file Collect Sub-quotes Prepare Estimate Approval Meeting 4 hrs 8 hrs 24 hrs 2 hrs 4 hrs 2 hrs 2 hrs 8 hrs 48 hrs 8 hrs 24 hrs 8 hrs 8 hrs # of People: 1 2 1 1 2 2 6 Transport: Manual Manual E-mail Phone E-mail E-Mail WIP: 2 2 4 1 3 2 3 Who: Sales Ops Sales/Ops Sales/Ops Sales/Ops Sales Sales VA/NVA VA NVA VA NVA NVA NVA NVA • Cycle times too long • Too much “queue time” between steps • No process standardization • Transportation issues • Too many people involved in Approval Time Value Map 43 days
Step 7: Identify Areas of Improvements • Improvements should be made based on waste analysis identified during VSM activity. • Example: Opportunities identified in the Generating an Estimate for a Customer VSM : • Create standard work for operators to follow • Develop “templates” to use when “Developing Quotes” • Remove NVA steps when possible • Streamline information flow from Customer to Estimator • Mitigate interruptions to “flow” estimate (reduce queue time) • Improve policies with Sales to obtain timely quotes • Reduce the number of people required for the “Approval Meeting”
Step 7: Create An Action Plan • Action plans are critical to successfully implementing VSM improvements • Determine improvement projects, schedules and owners • Immediate improvements (2 - 5 days): Kaizen Events • Medium term improvements (3-6 months): Lean/ GB projects • Long term improvements (6+ months): Lean Expert/ BB projects
high Sweet Spot High Hard Impact Just Do It Don’t Do low high Effort Step 7: Create An Action Plan • Identify the high impact improvements and long term and short term actions
Value Stream Mapping Quick Start