Download

1 / 19
190 likes | 295 Vues
Explore the short-run trade-off between inflation and unemployment through the Phillips Curve. Discover how policy choices impact the economy, the role of expectations, and the implications of supply shocks. Learn about the natural rate hypothesis and the costs of reducing inflation.

E N D
The Short-Run Trade-Off Between Inflation and Unemployment Chapter 5
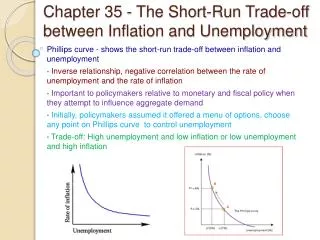
Philips Curve • Phillips curve: shows the short-run trade-off between inflation and unemployment • 1958: A.W. Phillips showed that nominal wage growth was negatively correlated with unemployment in the U.K. • 1960: Paul Samuelson & Robert Solow found a negative correlation between U.S. inflation & unemployment, named it “the Phillips Curve.”
So What? • “The Phillips curve shows the combinations of inflation and unemployment that arise in the short run as shifts in the aggregate-demand curve move the economy along the short-run aggregate supply curve” (803).
P inflation SRAS B B 5% 105 A A 103 AD2 3% PC AD1 Y 6% u-rate 4% Y2 Y1 Example: • PL=100 in 2020 • Two outcomes are possible in 2021 • If AD is high… PL rises by a lot (output increases substantially) (B) • If AD is low… PL rises by a little (output increases slightly) (A)
Analysis of the graphs: • Both graphs are connected • As “A” moves to “B” the output increases • Higher output= higher demand for workers • Higher demand for workers= lower unemployment • As “A” moves to “B” the PL increases • Increasing the PL increases the rate of Inflation
Shifts in the Philips Curve: The Role of Expectations • Fiscal and monetary policies affect the AD; therefore, the PC offers policymakers a menu of choices: • low unemployment with high inflation • low inflation with high unemployment • anything in between
The Vertical Long-Run Phillips Curve • Natural-rate hypothesis: the claim that unemployment eventually returns to its normal or “natural” rate, regardless of the inflation rate • Based on the classical dichotomy and the vertical LRAS curve
P Inflation LRAS LRPC P1 P2 AD2 high inflation low inflation AD1 Y u-rate Natural rate of output Natural rate of unemployment Therefore…
Graph Analysis: • Since the LRAS curve is vertical, and output stays constant, any increase in AD just increases Inflation.
Quick Vocabulary: • Expected Inflation: • Measure of how much people expect the overall PL to change
The Phillips Curve Equation: • Unemployment Rate (UR) • Natural Rate of Unemployment (NRU) • Actual Inflation (AI) • Expected Inflation (EI) UR= NRU+ a(AI – EI) a= in a parameter of how much unemployment responds to unexpected inflation
Answers: Short run Fed can reduce u-rate below the natural u-rate by making inflation greater than expected. Long runExpectations catch up to reality, u-rate goes back to natural u-rate whether inflation is high or low.
Quick Vocabulary: • Natural-Rate Hypothesis: • Claims that unemployment eventually returns to its normal, or natural, rate, regardless of the rate of inflation
Another PC Shifter: Supply Shocks • Supply shock: an event that directly alters firms’ costs and prices, shifting the AS and PC curves • Example: large increase in oil prices
P Inflation SRAS2 SRAS1 B B P2 A A P1 PC2 AD PC1 Y U-Rate Y1 Y2 Effects of Supply Shock:
Graph Analysis: • SRAS Curve shifts left: • Output decreases • Price level increases • Unemployment rises
Costs of Reducing Inflation: • Sacrifice Ratio: • The number or % points of annual output lost in the process of reducing inflation by 1% point • Rational Expectations: • The theory that people optimally use all the information they have including information about gov.t policies, when forecasting the future
Costs of Reducing Inflation: (Sacrifice ratio) • Typical estimate of the sacrifice ratio: 5 • To reduce inflation rate 1%, must sacrifice 5% of a year’s output. • Can spread cost over time, e.g. To reduce inflation by 6%, can either • sacrifice 30% of GDP for one year • sacrifice 10% of GDP for three years
Costs of reducing Inflation:(Rational Expectations) • Ex. • Fed claims that they’re going to reduce inflation • Expected Inflation decreases (SRPC shifts downward) • Result: • Disinflations can cause less unemployment that the traditional sacrifice ratio predicts.