Using Point & Figure Relative Strength
Using Point & Figure Relative Strength. Tom Dorsey Dorsey, Wright & Associates www.dorseywright.com. Are you prepared to be an Army of One?. Your Target Market … Baby Boomers. People aged 50 and older….. Control $7 trillion in wealth Comprise 70% of all US wealth

Using Point & Figure Relative Strength
E N D
Presentation Transcript
Using Point & Figure Relative Strength Tom Dorsey Dorsey, Wright & Associates www.dorseywright.com
Are you prepared to be an Army of One?
Your Target Market … Baby Boomers People aged 50 and older….. • Control $7 trillion in wealth • Comprise 70% of all US wealth • Have $2 trillion in annual income • Account for 50% of all discretionary spending • Spend $610 billion in healthcare spending • Are targeted with only 5% of all advertising dollars (Source: Ken Dychtwald; Age Power: How the 21st Century Will Be Rulled by the New Old)
S&P 500 Point & Figure Chart 1998 2004 Mr. Jones is exactly where he was in 1998, almost 6 years later, if he invested in the S&P 500 !
4 Step Process to Investing • Market Indicators - Is risk high or low? • Sector Indicators - Opportunities • Inventory – ETF’s, Stocks, Mutual Funds, etc. • Point & Figure Chart – When to Buy & Managing the Trade
80 – 20 Rule Most Trades Large Winners Large Losers RS tools allow us to capture large winners and avoid large losers.
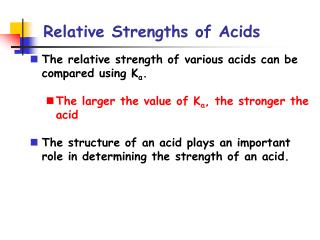
RELATIVE STRENGTH • The majority of relative strength changes will lie in the middle of the curve. However, all of the positive outliers will have given relative strength buy signals and all of the negative outliers have given relative strength sell signals. • Signals last eighteen months to two years on average. • 3 Main Types of Relative Strength: • Stock versus Market • Stock versus Peer Group • Sector or Asset Class versus Market
Stock RELATIVE STRENGTH • RS Reading Formula: Stock Price / SPXEWI X 100 • Scale is uniform for all prices. • RS Readings are done every evening. • A double top signals a positive relative strength reading and a double bottom signals a negative relative strength reading. Signals are most important. • Positive relative strength doesn’t mean the stock has to go up and vice versa.
RELATIVE STRENGTH • RS Reading Stock Px / SPXEWI x 100 • For example: XYZ Corp: 81 / 1252 x 100 = 6.47 XYZ Corp: 74 / 931 x 100 = 7.95 • While the stock price has fallen and the market has fallen, the relative strength calculation has actually moved higher. This means the stock is performing better relative to the market.
“Point & Figure Charting, 2nd Edition” by Tom Dorsey; Published 2001 Page 100: “Overall weak RS stocks that reverse back to O’s are dangerous, and in most cases should be avoided, or potentially shorted. A case in point is Worldcom (WCOM). Worldcom R.S.
XM Satellite Radio (XMSR) XMSR RS Chart XMSR Price Chart
PEER RELATIVE STRENGTH • How well is a stock doing relative strength to other stocks in its sector? • Peer RS Reading Formula: • (Stock Price / DWA Sector) X 100 • A buy signal on the Peer RS chart suggests the stock is likely to outperform others in the group. Conversely, a sell signal on the Peer RS chart suggests the stock is likely to underperform others in the group.
RELATIVE STRENGTH:Technical attributes • RS Versus the Market Signal • RS Versus the Market Column • RS Versus Peer Group Signal • RS Versus Peer Group Column • Trend Strong Stocks Have at Least 3 Positive Technical Attributes
SECTOR/ASSET CLASS RELATIVE STRENGTH • We use Sector Relative Strength to determine which sectors are outperforming the market. • Sector RS Reading Formula: DWA Sector Index X 100 = Sector RS Reading SPXEWI • For sector relative strength, we look at the column of the chart for guidance. When the Sector RS chart is in X’s it suggests that sector will outperform the market while a column of O’s suggests underperformance from that sector.
DWA Telephone Sector (DWATELE) DWATELESPXEWI 1/22/98 122.756 923.18 4/12/00 228.3091157.76 + 86.0 % + 25.4 % 4/12/00 228.309 1157.76 10/22/02 92.156930.20 - 59.6 % - 19.7 % 10/22/02 92.156 930.20 04/21/04 177,7001393.96 + 92.15 % + 49.85 %
DWA Food Sector(DWAFOOD) DWAFOODSPXEWI O’s 3/19/99 153.902 1068.74 4/03/01 147.9641116.65 - 3.9 % + 4.5 % X’s 4/03/01 147.964 1116.65 12/02/02 176.6891039.21 + 19.4 % - 6.9 % O’s 12/02/02 176.689 1039.21 04/21/04 211.151393.96 + 19.5 % + 34.13 % 0 2 / 0 3 / 0 4 9 9 / 0 0 / 0 1 0 1 / 0 2
You can observe a lot just by watching…. Internet HOLDRs (HHH) iShares Dow Jones Technology (IYW) iShares Dow Jones Telecom (IYZ) B-Bell 2/22/00 4/14/00 5/02/00
You can observe a lot just by watching…. iShares Goldman Sachs Networking (IGN) iShares Dow Jones Technology (IYW) Broad Based Semiconductor HOLDRs (SMH) 12/02/02 11/01/02 11/04/02
iShares Dow Jones Real Estate (IYR) RS Chart IYRIYY O’s 10/30/95 48.50 26.11 5/10/00 67.85 63.68 + 39.9 % + 143.9 % X’s 5/10/00 67.85 63.68 4/21/04 94.15 53.51 + 38.76 % - 15.9 %
iShares Dow Jones Utilities (IDU) RS Chart IDUIYY O’s 11/02/01 63.50 50.26 4/21/04 57.11 53.51 - 10.06 % + 6.46 %
Semiconductor Sector DWASEMI Rel. Str. Chart Reversal up to X’s on 7/9/03: Which stock to buy?? Use Technical Attributes to stack the odds in your favor DWASEMI: up 32% from RS reversal up to 4/22/04 SPXEWI: up 21% from RS reversal up to 4/22/04 Note current reading is 16.37
Microchip (MCHP) Technical Attributes: (2 for 5) Mkt RS Signal: Sell Mkt RS Column: X Peer RS Signal: Sell Peer RS Column: O Trend: Positive Which Stock to Buy? Int’l Rectifier (IRF) Technical Attributes: (4 for 5) Mkt RS Signal: Buy Mkt RS Column: X Peer RS Signal: Sell Peer RS Column: X Trend: Positive
Stacking the Odds in Your Favor • DWA Semiconductor Sector RS Chart Reverses Up on 7/9/03: • Look to stocks to take positions in Semiconductor Stocks • Microchip (MCHP) has 2 for 5 Positive Technical Attributes • International Rectifier (IRF) has 4 for 5 Positive Technical Attributes • 7/9/03 to 4/22/04: • DWASEMI: + 31.87 % • SPXEWI: + 21.69 % • MCHP: + 5.51 % • IRF: + 52.02%
SMLSPX 1/04/89 58.36 279.43 1/13/92 75.11414.34 28.7 % 48.3 % in O’s 1/13/92 75.11 414.34 2/26/97 145.96803.69 94.3 % 93.9 % in X’s 2/26/97 145.96 803.69 2/17/00 209.871388 43.8 % 72.7 % in O’s 2/17/00 209.87 1388 4/21/04 285.951124.12 in X’s + 36.25 % - 19.01 % S&P Smallcap (SML)RS Chart X’s = SML – Small Cap Outperform O’s = SPX – Large Cap Outperform 8 9 t o 9 2 9 2 t o 9 7 9 7 t o 0 0 0 0 t o 0 4
SPX: Equal Weight or Cap Weight? X’s = RSP – Equal Weight S&P 500 O’s = SPY – Cap Weight S&P 500 SPXEWISPX 12/23/96 747.10 746.92 5/24/99 1154.731306.65 54.6 % 74.9 % in O’s 5/24/99 1154.73 1306.65 11/18/99 1138.521424.94 1.4 % 9.1 % in X’s 11/18/99 1138.52 1424.94 5/23/00 1147.981373.86 .8% - 3.6 % in O’s 5/23/00 1147.98 1373.86 4/21/04 1393.961124.12 in X’s 21.4 % - 18.1 %
SPX Cap Weight SPXEWI
iShares Lehman 20+ Bond Fund (TLT) DatesTLTSPXEWI 9/07/01 78.44 1139.04 7/15/03 87.751157.11 TLT on Buy 11.9% 1.6% 7/15/03 87.75 1157.11 4/21/04 84.091393.96 TLT on Sell -4.17% + 20.4%
iShares MSCI Brazil Index (EWZ)vs.iShares Latin Am 40 Index (ILF) iShares MSCI Mexico Index (EWW)vs.iShares Latin Am 40 Index (ILF) 5/9/03 Rev Dn. EWW: + 50.03 % ILF: + 37.8 % 10/31/02 Rev Up. EWZ: + 110.44 % ILF: + 69.01 %
Offensive Only Play Book Beginning of 2000: Age: 45 Expected Retirement Age: 65 Account Value: $ 500,000 Expected Annual Rate of Return: 11% Average Annual Contribution: $ 15,000 Fee to the Broker: 1.25% fee ($ 6250) Projected Account Value at 65: $ 4,000,000 Annual Withdrawal of 3%: $ 120,000 At Retirement Fee to the Broker: $ 50,000 (at 1.25%)
Offensive Only Play Book Beginning of 2004: You performed with the S&P 500 over the last three years; losing 10.13% in 2000, 13.04% in 2001 and 23.37% in 2002 before rallying 26.4% in 2003. Age: 49 Expected Retirement Age: 65 Account Value (includes $60,000 in contributions): $ 460,297 Expected Annual Rate of Return: 11% Average Annual Contribution: $ 15,000 Fee to the Broker: 1.25% fee Projected Account Value at 65: $ 2,345,263 Annual Withdrawal of 3%: $ 70,358 At Retirement Fee to the Broker (1.25%): $ 29,316
Realistic Choices …… As the Client… To get back to $4,000,000 at Retirement: • Increase your annual contribution to $60,000 a year from $15,000 • Increase the annual rate of return to 15% (versus 11%) • Increase your retirement age to 71, 6 years less of retirement Employ risk management strategies to preserve wealth along the way.
S&P 500 Point & Figure Chart 1998 2004 Mr. Jones is exactly where he was in 1998, almost 6 years later, if he invested in the S&P 500 !
4 Step Process to Investing • Market Indicators - Is risk high or low? • Sector Indicators - Opportunities • Inventory – Fundamentals or fund families • Point & Figure Chart – When to Buy & Managing the Trade
NYSEBullish Percent 0 4/2/03 1997 1998 1999 2000 2001 2002 2003/04