Download
1 / 24
240 likes | 370 Vues
Houston Clear. Houston Hazy. Assessing PM 2.5 Background Levels and Local Add-On. Prepared by Bryan Lambeth, PE Field Operations Support Division Texas Commission on Environmental Quality For presentation at the National Air Quality Conference 2010. Causes of High PM 2.5.

E N D
Houston Clear Houston Hazy Assessing PM2.5Background Levelsand Local Add-On Prepared by Bryan Lambeth, PE Field Operations Support Division Texas Commission on Environmental Quality For presentation at the National Air Quality Conference 2010
Causes of High PM2.5 • Regional and long-range transport • Haze, smoke, and/or dust already in the air coming into an area from distant sources • Cannot be controlled by local mitigation measures • Local primary and secondary sources • Local add-on of PM2.5 is increased by local air stagnation, limited vertical mixing of the air, and high relative humidity • Urban worst case is usually night-time winter stagnation with clear skies
Estimating Transport Contribution • Upwind monitors and monitors that are not downwind of significant local sources provide the best estimate of incoming background levels from transport • These monitors will usually have the lowest concentrations in the area • Thus for areas with adequate peripheral monitoring coverage, the area lowest or second lowest concentration can serve to estimate the contribution from transport on most days • The variation between the lowest and second lowest measurements may often indicate variability in the incoming background levels across an area with adequate monitoring coverage
Estimating Local Add-On • Once the incoming background level has been estimated, concentrations higher than this background can indicate either variability in the background levels and/or add-on from local sources • Subtracting the estimated background from a given measurement provides an estimate of impacts directly from local sources, but this estimate can be biased high when there is large spatial variability in the incoming background level • Where speciation data are available for both background and add-on locations, the speciated components of local source impacts can also be evaluated by this method
Coastal Transport Regional Transport Conditional Transport Background PM2.5 Sites
Coastal Transport Conditional Transport Southeast Texas PM2.5 Sites
Conditional Transport North Central Texas PM2.5 Sites
Regional Transport Conditional Transport Central Texas PM2.5 Sites
Coastal Transport South Texas PM2.5 Sites
Texas PM2.5 Annual Averages 2008 6.8 7.6 11.5 11.9 11.2 9.9 15.9 11.1 8.7 9.9 5.7 10.5 10.6 10.5 14.0 12.5 9.5 6.1 8.8 10.7 10.3 11.3 12.1 12.0 Micrograms/cubic meter
Texas PM2.5 Background Averages 2008 6.8 7.6 8.8 8.0 9.9 5.7 8.3 8.6 7.9 9.6 8.7 9.5 6.1 8.8 Micrograms/cubic meter
Average of Daily Area Peak Local Add-On 2008 5.3 4.6 3.3 3.8 3.1 6.9 6.0 3.2 Micrograms/cubic meter
Highest Annual Local Add-On 2008 3.9 3.1 2.2 2.7 2.0 5.3 4.4 2.0 Micrograms/cubic meter
Highest Annual Local Percent Add-On 2008 32.4% 26.0% 20.8% 25.3% 18.7% 37.8% 31.5% 16.9% Micrograms/cubic meter
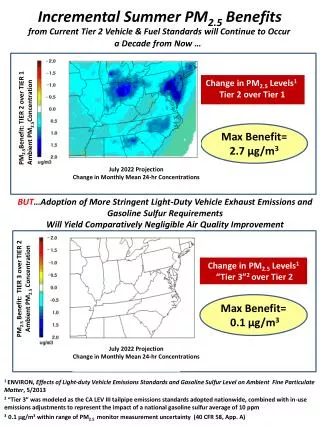
Conclusions • For the areas analyzed, transport appears to account for at least about 70-80% of measured annual averages at sites with the greatest local source impacts • At most about 20-30% of the annual average at analyzed sites with the worst local source impacts can be addressed by local control measures
Applications • Analysis of “but for” considerations in determining exceptional event days • This approach could be used to estimate whether a site would have exceeded the standard with a “normal” background level if the exceptional event had not occurred • Estimating how much local add-on must be reduced to meet standards • Model validation