Download
1 / 41
410 likes | 514 Vues
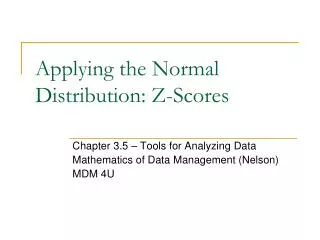
Learn the significance of z-scores in comparing data distribution, measuring variability using standard deviation, and converting raw scores. Understand the Normal Curve Model and how to compute probability and percentiles. Discover how z-scores enhance data analysis.

E N D
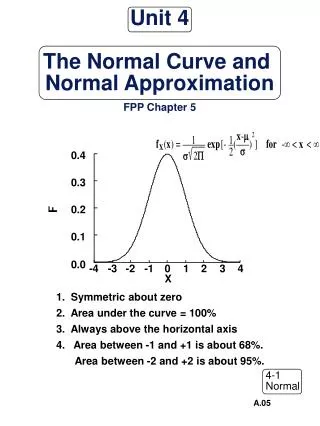
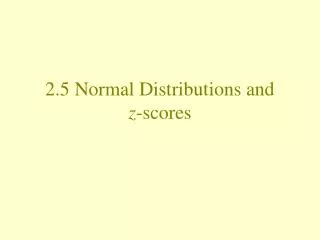
Chapter 5Describing Data with z-scores and the Normal Curve Model
Measures of VariabilityToward a Useful Measure of Variability:The Standard Deviation • This is the most useful and most commonly used of the measures of variability. • The standard deviation looks to find the average distance that scores are away from the mean. • Conversely, the standard deviation is the average amount of error we would expect if I used the sample mean to predict every score.
Measures of VariabilityToward a Useful Measure of Variability:The Standard Deviation • The standard deviation looks to find the average distance that scores are away from the mean.
Measures of VariabilityToward a Useful Measure of Variability:The Standard Deviation • The standard deviation looks to find the average distance that scores are away from the mean.
Measures of VariabilityToward a Useful Measure of Variability:The Standard DeviationThe Sums of Squares The full name for this is the sum of the squared deviations from the mean.
Measures of VariabilityToward a Useful Measure of Variability:The Standard DeviationThe Variance The sample variance is the average of the squared deviations of the scores around the sample mean.
Measures of VariabilityToward a Useful Measure of Variability:The Standard DeviationFinally!!! The standard deviation looks to find the average distance that scores are away from the mean.
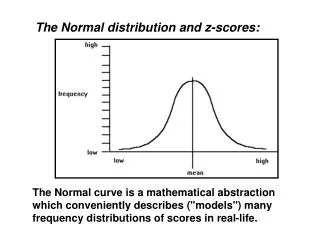
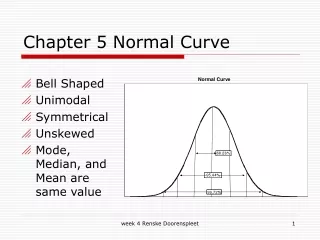
Measures of VariabilityThe Normal Curve and the Standard Deviation • If we know the mean and the standard deviation of normally distributed scores, we know a LOT of things.
The Normal Curve ModelWhy is it important to know about z-scores? • Because normally, raw scores are totally meaningless. • The best we can do is compare a raw score to other’s raw scores. • z-scores allow us to calculate a person’s relative standing in a distribution, relative to all other scores. • They allow us to compare two different scores. • We can compare apples and oranges!
The Normal Curve ModelUnderstanding z-scoresConverting Raw Scores to z-scores • z-scores take the mean and standard deviation of a distribution, and use this information to produce a numerical value to describe the location of individual raw scores in the population distribution. • or the sample distribution…..
The Normal Curve ModelUnderstanding z-scores • z-scores produced from different sources can be compared directly. If you scored a 32 on an English test and a 73 on a Math can you compare the scores? Not directly, but if both raw scores were converted to z-scores, then we could. • An entire set of raw scores can be converted to z-scores. The resulting distribution will have the same shape as the original distribution, will have a mean of 0, and a standard deviation of 1.
The Normal Curve ModelUnderstanding z-scoresConverting z-scores to Raw Scores • z-scores can be converted back to raw scores. • or the sample distribution…..
The Normal Curve ModelUnderstanding z-scoresCreating a z-score Distribution 0 -3 -2 -1 1 2 3
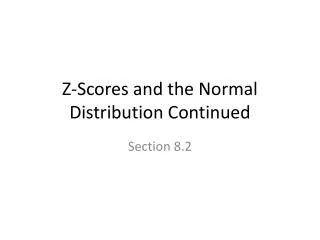
The Normal Curve ModelUnderstanding z-scoresComputing Probability • Just like all probability distributions, we can compute percentiles in this distribution by looking at the portion of the curve falling to the left. • A z-distribution is a special case because it has been studied VERY much. We know ALL about it. We know the percentile of ALL points in the distribution. • If we know a persons z-score we can compute their percentile.
The Normal Curve ModelUnderstanding z-scoresConverting from Raw Scores to Percentiles and Back Again • If we know X then: • If we know percentile then:
The Normal Curve ModelIt’s Like Comparing Apples and Oranges • I went to the cafeteria the other day with just $1. A piece of fruit costs exactly $1. I can buy just one piece of fruit. I am a real bargain shopper though. I definitely want to get the best value for my $1. • I found two pieces of fruit left, an orange that weighs 9 ounces and an apple that weighs 9 ounces • I want to know which one is the more outstanding fruit, which one is better value for my $1.
The Normal Curve ModelIt’s Like Comparing Apples and Oranges 50% 50% 3 oz 4.5 oz 6 oz 7.5 oz 9 oz My apple
The Normal Curve ModelIt’s Like Comparing Apples and Oranges 6 oz 8 oz 10 oz 12 oz 14 oz My orange
The Normal Curve ModelIt’s Like Comparing Apples and Oranges Orange Apple
Measures of VariabilityThe Normal Curve and the Standard Deviation • If we know the mean and the standard deviation of normally distributed scores, we know a LOT of things.
The Normal Curve ModelWhy is it important to know about z-scores? • Because normally, raw scores are totally meaningless. • The best we can do is compare a raw score to other raw scores. • z-scores allow us to calculate a person’s relative standing in a distribution, relative to all other scores. • They allow us to compare two different scores. • We can compare apples and oranges!
The Normal Curve ModelUnderstanding z-scoresConverting from Raw Scores to Percentiles and Back Again • If we know X then: • If we know percentile then:
The Normal Curve ModelComputing Probability of a Single Score • If exam scores are normally distributed with M = 56.8 and SX = 8.14, what is the probability of selecting one score from the population that is less than 62? • We would first convert the raw score to a z-score. • The question becomes, what is the probability of achieving a z-score lower than +.64. • We would look in the chart and find that .2389 fall between the mean and z, another .5000 falls below the mean, therefore such that we can say that the raw score of 62 is at the 73.89th percentile. • However, the question was probability of a score less than 62 which is 73.89%.
The Normal Curve ModelComputing Probability of a Single Score • If IQ scores are normally distributed with m = 100 and s = 15, what is the probability of selecting one score from the population that is greater than 123? • We would first convert the raw score to a z-score. • The question becomes, what is the probability of achieving a z-score higher than +1.53. • We would look in the chart and find that .4370 fall between the mean and z, such that we can say that the raw score of 123 is at the 93.7th percentile. • However, the question was probability, so we look at the tail and find .0630, so that the probability of a score of 123 or higher occurring is only 6.30%.
The Normal Curve ModelComputing Probability of a Sample Mean • If IQ scores are normally distributed with m = 100 and s = 15, what is the probability of selecting a sample of four scores from the population that have a mean greater than 123? • To answer this, and other similar questions, we need to first understand the sampling distribution of means.
The Normal Curve ModelThe Sampling Distribution of Means • If we have a population of raw scores, we could draw a sample of size 4 from it. • In fact, we could draw many samples of size 4 from it (an infinite number if you want to do this for the rest of your life!). • If we draw many samples and compute the means from each sample… • then create a distribution of these means… • we have created a sampling distribution of means.
The Normal Curve ModelThe Sampling Distribution of Means f 98 94 104 70 85 100 115 130 118
The Normal Curve ModelThe Sampling Distribution of Means f 87 99 108 103 70 85 100 115 130
The Normal Curve ModelThe Sampling Distribution of Means f 97 109 106 70 85 100 115 130 52
The Normal Curve ModelThe Sampling Distribution of Means f 70 85 100 115 130
The Normal Curve ModelThe Sampling Distribution of Means • The sampling distribution of means will have a mean equal to the m of the population of raw scores.
The Normal Curve ModelThe Sampling Distribution of Means • However…
The Normal Curve ModelThe Sampling Distribution of Means • Instead, the sampling distribution of the means will have a standard deviation (now called the standard error of the mean, or just standard error) that is directly related to the size of the s of the original population and the size of the samples in the following manner:
The Normal Curve ModelThe Sampling Distribution of Means • Therefore…
The Normal Curve ModelThe Sampling Distribution of MeansThe Central Limit Theorem • A sampling distribution is ALWAYS an approximately normal distribution. • It does not matter at all what shape the distribution of raw scores looked like. • The larger the sample size, the more normal the distribution of sample means becomes.
The Normal Curve ModelThe Sampling Distribution of MeansThe Central Limit Theorem • The mean of the sampling distribution is ALWAYS equal to the mean of the underlying raw score population from which we create the sampling distribution.
The Normal Curve ModelThe Sampling Distribution of MeansThe Central Limit Theorem • The central limit theorem states • “For any population with a mean of m and standard deviation sX, the distribution of sample means for sample size n will have a mean of m and a standard deviation of and will approach a normal distribution as n approaches infinity.”
The Normal Curve ModelComputing Probability of a Sample Mean • If IQ scores are normally distributed with m = 100 and s = 15, what is the probability of selecting a sample of four scores from the population that have a mean greater than 123? • First we need to convert the sample mean into a z-score. • Then we’ll need to look up the probability of the corresponding z-score.
The Normal Curve ModelComputing Probability of a Sample Mean • First we’ll figure out the standard error. • Then we’ll calculate a z-score using a slightly different formula: • Then we’ll look this z-score up on the charts just like before.
The Normal Curve ModelComputing Probability of a Sample Mean • What is probability of buying a bag of a dozen oranges whose average weight is 9 oz or less? • Remember, oranges weigh m = 10 oz with s = 2 oz
The Normal Curve ModelComputing Probability of a Sample Mean • First we’ll figure out the standard error. • Then we’ll calculate a z-score: • Then we’ll look this z-score up on the charts.