Decisions under uncertainty
430 likes | 764 Vues
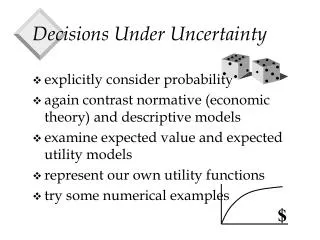
Decisions under uncertainty. A Different look at Utility Theory. Overview. The author says that economic decisions made under uncertainty are essentially gambles. Let’s first look at some gambles, and then come back to decisions under uncertainty.

Decisions under uncertainty
E N D
Presentation Transcript
Decisions under uncertainty A Different look at Utility Theory
Overview The author says that economic decisions made under uncertainty are essentially gambles. Let’s first look at some gambles, and then come back to decisions under uncertainty. Initially, our gamble will be to flip a fair coin (one where the probability of a head is .5 and the probability of a tail is .5). The payout will depend on which side of the coin is showing when the coin lands at rest.
Examples Facts about several gambles with a fair coin: Gamble 1 – heads means you win $100 and tails means you lose $0.50 Gamble 2 – heads means you win $200 and tails means you lose $100 Gamble 3 – heads means you win $20000 and tails means you lose $10000 Note what a person would lose on each gamble. Many people would say the loses in gambles 2 and 3 make them uneasy and they wouldn’t take those gambles. But, some folks out there might take gambles 2 and 3.
Digress – the mean What is the mean or the average of the numbers 4 and 6? You probably said 5 and you are right. This could be written (4+6)/2 = (4/2) + (6/2) = (1/2)4 + (1/2)6, where in this last form you see each number multiplied by ½. In this context the mean is said to be a simple weighted average, with each value weighted by ½. What would the weights be if we wanted the average of 4, 5, and 6? 1/3! In general with n numbers the weight is 1/n. In other situations we may look at a weighted average (not simple), though the weights are found in a different way.
Back to example The expected value of a gamble is a weighted average of the possible payout values and the weights are the probabilities of occurrence of each payout. We talk about EVi as the expected value of gamble i. EV1 = .5(100) + .5(-0.50) = 50 – 0.25 = 49.75. (Notice when you lose the loss is subtracted out.) EV2 = .5(200) + .5(-100) = 100 – 50 = 50 EV3 = .5(20000) + .5(-10000) = 10000 – 5000 = 5000
Example In our example the EV for each gamble is positive. The EV is the highest for gamble 3. But, remember we said not many folks would probably like it because of the uneasiness they would feel by losing the 10000. A couple of guys named Von Neumann (both names are just the person’s last name) and Morgenstern created a model we now call the expected utility model to deal with situations like this. They indicated folks make decisions based not on monetary values, but based on utility values. Of course the utility values are based on the monetary values, but the utility values also depend on how people view the world.
Expected Utility Say we observe a person always buying chocolate ice cream over vanilla ice cream when both are available and both cost basically the same, or even when chocolate is more expensive and always when chocolate is the same price or cheaper. So by observing what people do we can get a feel for what is preferred over other options. When we assign utility numbers to options the only real rule we follow is that higher numbers mean more preference or utility. Even when we have financial options we can study or observe the past to get a feel for our preferences.
Expected Utility Theory is a methodology that incorporates our attitude toward risk (risk is a situation of uncertain outcomes, but probabilities are known) into the decision making process. It is useful to employ a graph like this in our analysis. In the graph we will consider a rule or function that translates monetary values into utility values. The utility values are our subjective views of preference for monetary values. Typically we assume higher money values have higher utility. Utility value Monetary value
In general we say people have one of three attitudes toward risk. People can be risk avoiders, risk seekers , or indifferent toward risk (risk neutral). Utility value Utility values are assigned to monetary values and the general shape for each type of person is shown at the left. Note that for equal increments in dollar value the utility either rises at a decreasing rate(avoider), constant rate or increasing rate. Risk avoider Risk indifferent Risk seeker Monetary value
Here we show a generic example with a risk avoider. Two monetary values of interest are, say, X1 and X2 and those values have utility U(X1) and U(X2), respectively Utility U(X2) U(X1) $ X1 X2
Expected Utility In expected utility theory we want to focus on wealth values and utility values. Gambles will lead to adjustments in wealth. Let’s call W the initial wealth which can always be retained if no gamble is taken, and call the wealth at a loss X1 = W – loss, and the wealth at a win X2 = W + win. The expected value of wealth from a gamble is then (p1 is the probability of a loss and p2 is the probability of a win) EV = p1X1 + p2X2 Note we called the expected value of a gamble EV and I now have the expected value of wealth with a gamble being EV. EV will mostly stand for expected value of wealth, unless otherwise stated.
Expected Utility The following is what needs to be considered to get the expected utility of a gamble: 1) Start with a person’s initial wealth W, 2) If the gamble is taken identify X1 and X2, 3) Assign to each wealth value in 2) the respective utility value U1, and U2 and in a graph connect the U1 and U2 values with a chord. 4) Calculate the expected value of wealth with the gamble EV. 5) Calculate the expected utility of the gamble as EU where EU = p1U1 + p2U2, and find the value on the chord above the EV.
Utility U2 U1 EU $ X1 EV X2
Example continued Say utility is assigned by the function U = sqrt(wealth) and a person has initial wealth 10000. Then for the three gambles we had before the EU’s would be EU1 = .5sqrt(9999.5) + sqrt(10100) = 100.248 EU2 = .5sqrt(9900) + sqrt(10200) = 100.247 EU3 = .5sqrt(0) + sqrt(30000) = 86.603 So in terms of EU’s the preferred order of gambles for this person is gamble 1, then 2, and the 3. When we looked at EV’s the order was 3, 2, and 1. So expected utilities of gambles may have a different rank ordering than when looking at the EV’s.
Fair gambles A fair gamble is one where the expected value of the gamble is zero, i.e., p1(-loss) + p2(win) = -p1(loss) + p2(win) = 0. This implies that the expected value of wealth with the gamble is equal to the value of wealth when not gambling at all, which you might call your certain wealth. For fair gambles EV = p1(W – loss) + p2(W + win) = p1W +p2W – p1(loss) + p2(win) = (p1+p2)W + 0 = W, since p1+p2=1.
Risk averse fair gamble In this graph I have the generic view of a risk lover. With the fair gamble we have the EV and the EU is on the chord above the EV. If the person does not gamble wealth will be W and the utility there is just read off the utility function here as Uw (note a risk averter has diminishing marginal utility of wealth.) Utility Uw EU X1 X2 EV = W wealth
Risk Averse fair gamble For the fair gamble we again know EV = W, but for a risk averse person Uw > EU. Thus we can conclude risk averse folks will not accept fair gambles. On the next slide you can see I thickened part of the horizontal axis and the chord connecting the two points on the utility function associated with the wealth values under the gamble. The probabilities of the gamble could be changed (and the gamble would no longer be fair) and the only way the person would accept the gamble over having the certain wealth W is if the EV was greater than W*. So, a risk averse person may gamble, but it has to be at favorable odds.
Risk averse fair gamble If the EV of a gamble is above W* (and is no longer a fair gamble, but a favorable one), then the person will end up on the chord segment that has not been thickened and thus only then have EU>Uw. Utility Uw EU X1 X2 EV = W wealth W*
Risk Seeker fair gamble In this graph I have the generic view of a risk seeker. With the fair gamble we have the EV and the EU is on the chord above the EV. If the person does not gamble wealth will be W and the utility there is just read off the utility function here as Uw (note a risk seeker has increasing marginal utility of wealth. U EU Uw X1 EV =W X2 W
Risk Seeker fair gamble For the fair gamble we again know EV = W, but for a risk seeker person Uw < EU. Thus we can conclude risk seeker folks will always accept fair gambles. On the next slide you can see I thickened part of the horizontal axis and the chord connecting the two points on the utility function associated with the wealth values under the gamble. The probabilities of the gamble could be changed (and the gamble would no longer be fair) and the only way the person would NOT accept the gamble over having the certain wealth W is if the EV was less than W*. So, risk seeker may NOT gamble, but it has to be at unfavorable odds.
Risk Seeker fair gamble If the EV of a gamble is below W* (and is no longer a fair gamble, but an unfavorable one), then the person will end up on the chord segment that has not been thickened and thus only then have EU<Uw. . U EU Uw X1 EV =W X2 W W*
Risk Neutral fair gamble U The risk neutral person is indifferent between a fair gamble and not gambling at all. If odds are switched to favorable gambles will be favored and if switched to unfavorable gambles will not be taken. Uw = EU X1 EV =W X2 W
Certainty Equivalents In a more general sense we could talk about gambles that are fair or unfair. The certainty equivalent of a gamble will be the sum of money or wealth for which the individual would be indifferent between the certain sum and the gamble. We will examine these certainty equivalents for folks with risk aversion, neutrality and risk seeking prefrences.
Risk averse – certainty equivalent Utility The decision maker may have an option that is certain. If so, the EU is simply the utility along the utility curve (I called it Uw before). So in this diagram we see that any sure bet greater than Y has an expected utility greater than the expected utility of the risky option. U2 U1 EU $ Y EV X1 X2
Another Example Say Utility U = square root of X, where X is a dollar amount the person ends up with, Then U(4) = 2 and U(16) = 4, for example. Say a risky option will result in 4 50% of the time and 16 50% of the time. The expected value is 10 because .5(4) + .5(16) = 10 and the expected utility is 3 because .5U(4) + .5U(16) = .5(2) + .5(4) = 3. Now, if there is an option that will pay more than 9 with certainty, than the certain option is better. So, 9 is the certainty equivalent of this uncertain gamble. Let’s see this on the next slide.
U(x) U(16)=4 U(x) EU = 3 U(4)=2 4 9 10 16 x Any certain option above 9 gives a utility value greater than the expected utility of the uncertain option.
Risk seeker – certainty equivalent In this graph I have the generic view of a risk seeker. With the fair gamble we have the EV and the EU is on the chord above the EV. Y is the certainty equivalent of the gamble. Any certain option above Y would be preferred to the gamble shown by the risk seeker. U EU Uw X1 EV X2 W Y
In a previous section we mentioned that sometimes we face an uncertain situation with regards to monetary values. We saw 1) The expected monetary value, EV, of the uncertain situation (what I will now call a gamble) is the sum of some numbers, where each number is a monetary value multiplied by its probability of occurring, 2) The expected utility of a gamble (what I will now write as EU) is the sum of some numbers, where each number is the utility of a monetary value multiplied by its probability of occurring, 3) The expected utility of a gamble does not occur on the utility function (unless the person is risk neutral), but on the chord or line segment that connects utility values of each part of the gamble and directly above the EV of the gamble.
Say we have a risk lover and the gamble G leaves Y1 p1 % of the time and Y2 p2% of the time. U EV =p1Y1 + p2Y2 EU = p1U(y1) + p2U(Y2) U(Y2) EU U(Y1) Y Y1 EMV Y2
Say we have a risk avoider and the gamble G leavesY1 p1 % of the time and Y2 p2% of the time. U EMV =p1Y1 + p2Y2 EU = p1U(y1) + p2U(Y2) U(Y2) EU U(Y1) Y Y1 EMV Y2
On the last few slides I show you generic cases of a risk lover and a risk avoider. You see a gamble with monetary values Y1 and Y2, with associated probabilities p1 and p2 (where p2 = 1- p1). • I now want to show something we saw in the previous section, but I want to be more precise in my language. • Sometimes we may have an opportunity that is known with certainty. The utility of the opportunity will be on the utility function for the individual and will be noted U(C). • The decision rule for choosing between a gamble and a certain payoff is • choose the certain option when U(C) > E[U(G)], and • choose the gamble when U(C) < E[U(G)]. • Of course, when the two are equal the individual would be indifferent between the two.
Back on the slides I have some vertical dashed lines. I put them there on purpose. I want you to think of the location as values of a certain payoff, I now call C, and then we can see that U(C) = EU. The payoff C is called the certainty equivalent of the gamble.
Say we have a risk avoider and the gamble G leaves Y1 p1 % of the time and Y2 p2% of the time. U The risk premium, rp, of a gamble is the EV of the gamble minus the certainty equivalent of the gamble. rp = EV - C and will always be positive for a risk avoider. The risk premium for a risk lover will be negative and it will be zero for a risk neutral person. U(Y2) EU U(Y1) Y Y1 EV Y2 C
Say Y2 is value of property if no fire and Y1 is the value of the property with a fire. The EV = p1Y1 + p2Y2. EU = p1u(Y1) + p2U(Y2) A Gamble of no fire insurance U U(Y2) EU C is the certainty equivalent of the gamble. U(Y1) Y Y1 EV Y2 C
If a person buys insurance it changes the risky situation into a certain situation. If Y2 - C = fee paid for insurance the individual will have C with certainty. To see this we note If no fire the individual has Y2 - fee = C, and If fire the individual gets restored to Y2 and has still paid the fee so the certain property value is C. SOOOOOO Y2 - C is really the maximum fee the person would pay for insurance and they would like to pay less. Y2 – C is called the reservation price for insurance.
Let’s take the point of view of the insurance company - and we do not have to look at the graph here. They pay claim of Y2 - Y1 p1% of the time and they pay 0 p2% of the time for an expected claim of p1(Y2 - Y1) + p2(0) = p1(Y2 - Y1) This is called the actuarially fair insurance premium - meaning this is the minimum they have to charge to be able to pay out all the claims. Now look in the graph - here is an amazing result: Y2 - EV = Y2 - (p1Y1 + p2Y2) = Y2(1 - p2) -p1Y1 = p1(Y2 - Y1), so Y2 - EV is the actuarially fair premium
Review Y2 - EMV = least insurance company will charge, Y2 - C = Most person will pay, (Y2 - C) - (Y2 - EMV) = EMV - C is the room the person and the insurance company have to negotiate for the insurance. Before we said EMV - C was the risk premium and now we see it is the most the person would pay over the actuarially fair premium to insure against the gamble. Now insurance companies pay out claims and pay employees and electricity and other admin. expenses. The company has to get some of EMV - C to pay these expenses.
People won’t buy the insurance if the insurance company needs more than EMV - C to cover its other expenses because the person would have more utility without it in that case. Next let’s look at how information can be beneficial in reducing risk.
U situation without information situation with information Y Y1 C EMV Y2 U Y Y1’ c’ EMV’ Y2
On the previous slide I show two graphs. Both have the same utility function for an individual. The top graph is a situation where the individual has no information and the bottom graph shows what happens when more information is obtained. Note more information may not eliminate risk, but it can reduce it. Let’s study an example to show context. Say an individual can buy a painting and if it is a real master painting the wealth of the individual will be Y2. If the painting is a fake the individual will lose some of his expenditure because the painting is no big deal - wealth is Y1. We see the certainty equivalent of the gamble is C. Presumably the individual will buy the painting if the certainty equivalent of the gamble is better than his wealth by not buying the painting at all.
Now say the person can hire a painting expert to see if the painting is a fake or not. If the expert says the painting is a fake then you will not buy it and will not lose on the low end. But if it is a real painting you will have the same high end wealth because you will buy the painting. So information from an expert in this case gives you the same high end value but makes your low end value better than without information. But, the expert is going to want to charge you for the information. How much should you pay? Since C’ is the certainty equivalent with information and C is the certainty equivalent without the information, the person would pay up to C’ - C for the information and the utility of the person would be improved.