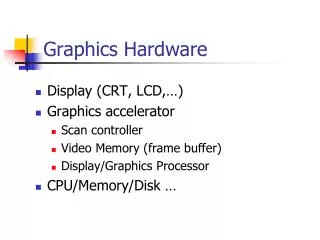
Graphics Hardware Trends
Interactive Visualization of Volumetric Data on Consumer PC Hardware: ... Interactive Visualization of Volumetric Data on Consumer PC Hardware: ...

Graphics Hardware Trends
E N D
Presentation Transcript
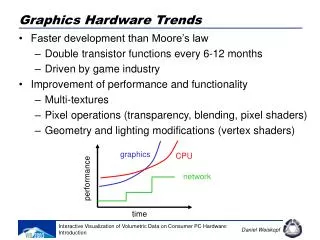
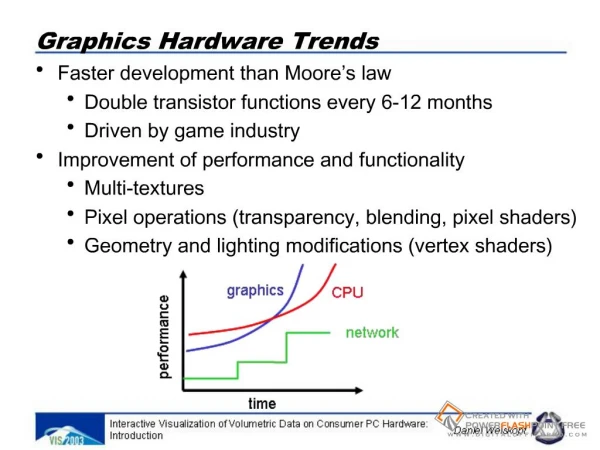
Slide 1:Graphics Hardware Trends
Faster development than Moore�s law Double transistor functions every 6-12 months Driven by game industry Improvement of performance and functionality Multi-textures Pixel operations (transparency, blending, pixel shaders) Geometry and lighting modifications (vertex shaders)
Slide 2:Transistor Functions
0 10 20 30 40 50 60 9/97 3/98 9/98 3/99 9/99 3/00 9/00 3/01 time (month/year) transistors (millions) Riva 128 (3M) NVIDIA GeForce3 (57M) ATI Radeon 8500 (60M) 9/01 3/02 70 80 90 100 ATI Radeon 9700 Pro (110M) NVIDIA GeForce FX 5800 (125M) NVIDIA GeForce4 (63M) 110 120
Slide 3:Typical GPU Characteristics
Brand Transistors Technology Clock rate Mem bandwidth Fill rate (peak) Pixel pipelines Textures per unit FSAA Bits per channel Tri transform (peak) Tris (3Dmark) Vertex shaders ATI Radeon 9800 P 107 M 0.15 micron 380 MHz 22 GB/s 3 GPixel/s 8 8 6 x 18 Gsample/s 10 380 M 19 M 4 NVIDIA GeForceFX 5900 U 130 M 0.13 micron 450 MHz 27 GB/s 1.8/3.6 GPixel/s 4/8 16 4 x 27 Gsample/s 10 315 M 28 M 4+ Source: www.tomshardware.com Geforce fx: Fillrate 1.8 (z and color) /3.6 GPixel/s (just z or just color); pixel pipelines: 4 (color and z), 8 (z, stencil, or color) Geforce fx: Fillrate 1.8 (z and color) /3.6 GPixel/s (just z or just color); pixel pipelines: 4 (color and z), 8 (z, stencil, or color)
Slide 4:Modern Scientific Visualization
Traditional plotting techniques are not appropriate for visualizing the huge datasets resulting from computer simulations (CFD, physics, chemistry, ...) sensor measurements (medical, seismic, satellite, �) Map abstract data onto graphical representations Try to use colorful 3D raster graphics in expressive still images recorded animations interactive visualizations �To see the unseen� �The purpose of computing is insight not numbers�
visualization pipeline classification different grid types ? different algorithms 3D scalar fields Cartesian (eg. medical datasets) 3D vector fields un/structured (eg. CFD) trees, graphs, tables, data bases InfoVisSlide 5:Visualization Pipeline and Classification
Slide 6:GPU and Visualization Pipeline
Renderer Texture-based techniques (e.g., for volume rendering) Large textured terrain height fields Mapper Classification in volume rendering Integrate ray segments (in unstructured volumes) Integrate particle traces (in flow fields) Assign color and transparency for NPR Filtering Data filtering in graphics memory Compression/decompression (of textures)
Slide 7:Visualization of Volumetric Data
Direct volume rendering of scalar fields Flow visualization in 3D Focus on regular grids
Slide 8:Visualization of Volumetric Data