Download

1 / 41

E N D
Prepared by: Biplab Saha Md. Mijanur Rahman Shayamal Krishna Debnath ID: 2009100400113 Md. Tanvir Hyder ID: 2009100400118 ID: 2009100400068 ID: 2009100400105 Supervised by: Minhaz Ahmed Lecturer Department of Textile Engineering
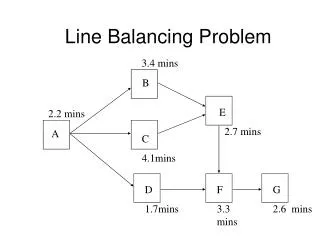
Introduction Line and work cell balancing is an effective tool to improve the throughput of assembly lines and work cells while reducing manpower requirements and costs. Assembly Line Balancing or simply Line Balancing (LB) is the problem of assigning operations to workstations along an assembly line, in such a way that the assignment be optimal in some sense. LB has been an optimization problem of significant industrial importance: the efficiency difference between an optimal and a sub-optimal assignment can yield economies (or waste) reaching millions of dollars per year. LB is a classic Operations Research (OR) optimization problem, having been tackled by OR over several decades. Many algorithms have been proposed for the problem. Yet despite the practical importance of the problem, and the OR efforts that have been made to tackle it, little commercially available software is available to help industry in optimizing their lines.
LINE BALANCING (Process Organization) The Line Balancing is “to design a smooth production flow by allotting processes to workers so as to allow each worker to complete the allotted workload within an even time”
LINE BALANCING (Process Organization) It is a system where we meet the production expectations and we can find the same amount of work in process in every operation at any point in the day.
Reasons to have balance the production line (1) Keeping inventory costs low results in higher net income (2) Keeping normal inventory levels lets the operator work all day long giving him/her the opportunity to earn more money by increasing his/her efficiency (3) Keeping the line balanced let’s the supervisors improve other areas because they can use their time better (4) Balanced production keeps prices low which turns into repeat sales (5) Balanced production means better production planning.
Balancing Method Method The most basic methods are the Time Study, Bottle Neck Process Theory and Data Collection and Analysis.
How do we start balancing the production line? Well we can start by determining how many operators for each operation are needed for a determined level of production. After this we need to determine how much WIP we need to anticipate production problems. Recommended WIP is 1-hour inventory level for each operation. A good range would be from 30 min to 120 min inventory level.
There are 3 rules for balancing (1) Have at least ½ hour of WIP for each operation (2) Solve problems before they become any larger (3) Meet production goals by keeping every operator working at their maximum capacity
Work In Process (WIP) What is WIP? WIP is made up of all garments and their parts that are not completely finished.
How can we manage WIP? (1) Production planning (2) Trims control (3) Production Build-up (4) Balancing (5) Cut Flow Control
OUT PUT HIGH Balancing Matrix Balancing Matrix LOW WIP LOW
Time Study What is time study? Time study is a work measurement technique for recording the time of performing a certain specific job or its element carried out under specific condition and for analyzing the data so as to obtain the time necessary for an operator to carry out at a defined rate of performance
Time Study Time study is a method of direct observation. A trained observer watches the job and records data as the job is being performed over a number of cycles. Time study equipment the stop watch in general, two types of watch are used for time study. Fly back Continuous These watches may be used any of the following time scales Seconds Decimal minutes Decimal hours
SMV SMV – time that is allowed to perform the job satisfactory. SMV = Basic time + Allowances Standard Minute Value SMV = B.T + Allowances
Basic Time The basic time for the operation is found by applying concept of rating to relate the observed to that of a standard place of working. Calculated as follows: Basic time = observed time * observed rating 100 (BT = Observed time * Observed Rating = A constant) 100
Example.. Rating 5075100 125 Observed time 1.20.80.60.5 Basic Time1.2*50 0.8*75 0.6*100 0.5*125 100 100 100 100 = 0.6 0.6 0.6 0.6
SMV calculation Element description Element description Obser Obser rating rating Obser. Obser. time time Basic Basic Time Time Freq. Freq. Basic Basic Time/Gmt Time/Gmt 95 95 0.32 0.32 0.304 0.304 1/30 1/30 0.010 0.010 Get bundle and sort parts Get bundle and sort parts 105 105 0.11 0.11 0.116 0.116 1/1 1/1 0.116 0.116 Match pocket flap to lining Match pocket flap to lining 100 100 0.48 0.48 0.480 0.480 1/1 1/1 0.480 0.480 Sew round flap Sew round flap 58 58 0.35 0.35 0.298 0.298 1/1 1/1 0.298 0.298 Trim threads and turn out Trim threads and turn out flap flap 90 90 0.56 0.56 0.504 0.504 1/1 1/1 0.504 0.504 Top stitch flap Top stitch flap 110 110 0.23 0.23 0.253 0.253 1/30 1/30 0.008 0.008 Close bundle and place Close bundle and place aside aside 1.416 1.416 Total Total
Total basic time/garment (brought forward) 1.416 Add machine attention allowances 7% 7% of (0.480 + 0.504) = 0.07 x 0.984 = 0.069 0.069 Basic time + MAA (1.416 + 0.069) 1.485 Add personal needs and relaxation allowances 14% 14% of 1.485 = 0.14 x 1.485 = 0.208 0.028 Standard minute Value (SMV) = Basic time + all allowances =1.485 + 0.208 = 1.693 (SMV)
Operators Performance rating Listed bellow are the twenty levels of performance used in the rating process. You will note that each definition has a corresponding percentage figure. It is this figure that is used in leveling.
Production Calculation Target = 60 (individual) SMV Line Target = Actual Minutes Total M/C SMV Actual Minutes = No. of M/C operators X working mints efficiency x present %
Efficiency and Performance Calculations Efficiency = Earned Minutes x 100 (of individual) Available minutes Earned minutes = No. of produced pieces X SMV of that activity Available Minutes = Working Minutes
Example 1 An operator worked for 8 hours on an activity of having a SMV of 5. She produced 82 pieces of that activity. What was her efficiency? Efficiency = 82 x 5 x 100 = 85.42% 8 x 60
Example 2. An operator worked for 9 hours on activity of having SMV of 1.21 & 0.80. She produced 195 & 250 of those activities respectively. What was her efficiency? Efficiency = 195 x 1.21 + 250 x 0.80 x 100 9 x 60 = 80.66%
Example 3 An operator worked for 8 hours on an activity of having a SMV of 5. She produced 82 pieces of that activity. She had 40 minutes of stoppage time due to machine breakdown & power failure. What was her performance? Performance = 82 * 5 * 100 ( 8 * 60) – 40 = 93.18%
Allowance and Calculation Personal Needs and Fatigue = 7.5% Other (Standing) = 4.0% Machine Machine Type Type Allowance Allowance % % DNL DNL SNL/BH SNL/BH DNC/50L DNC/50L SNC/30L SNC/30L BS/BT BS/BT Other Other 17.5 17.5 12.5 12.5 9.0 9.0 7.5 7.5 5.0 5.0 2.0 2.0
Operation TGT/HR = 60 SMV of the operation Line Target TGT/Working Time = No of operator * working mints Total machine SMV Overall Efficiency = Earned SAH *100 Clock hours On std Efficiency = Earned SAH *100 Clock HRS – Lost HRS
Production Planning Load and capacity Planning Successful planning requires knowledge of two variables to determine the time required to manufacture a contract. Load – How much work we are putting on a section Capacity – How much work a section is capable of completing In an ideal situation >> Load = Capacity
Load and capacity LOAD – Contract size x Work content Capacity – The amount of work the factory or section is capable of doing.
The scheduling rule Balance load and capacity Arrange the programmed of work so that the load can be achieved Use common units – standard minutes
Balancing & Capacity Capacity Load Uncertainty about the number of operators and performance Uncertainty about the number of garments to be sold Demand? Total numbers Speculation? Attendance hours Prediction? Absenteeism Uncertainty about work content Performance Standard minute value Learning curve Measured Uncertainty about the equipment Estimated Availability Reliability
The pre Production plan for the next 13 week season has provided the following information. Style Order qty SMV per Gmts. Total SMV’s Avon 10000 42 420000 Bar 8000 30 240000 Clyde 24000 20 480000 Dee 12000 65 780000 Calculate the average weekly load in standard minutes 1920000sm’s/13 weeks = 147692 SM’s a) If the factory employs 80 operators, has 4% absenteeism, works a 40 hour week, has a efficiency of 85%, b) what 80*40*0.96*0.85=156672sm’s is the weekly capacity in standard minutes? c) His the Factory sufficient capacity to meet the plan? d) I think its Yes
Pitch Time Reference value for synchronization in the division of labor is called Pitch Time (PT). Pitch Time provides average time allotted to each worker.
PITCH DIAGRAM (seconds) 160 Bottleneck Process 140 140 140 140 140 140 120 115 115 115 115 115 110 110 110 105 105 105 105 105 Work Allotment Time 100 80 95 95 95 140 140 140 140 140 80 60 70 40 20 A B C D E F G H Name of worker (In order of processes)
Bottleneck Process: The time at which the longest time is required is called “bottleneck Process” The state of line organization should be evaluated as “Organization Efficiency” Using the pitch time and Bottleneck Process Time. Pitch Time Organization Efficiency (%) = ________________________ x 100 Bottleneck Process Time 100 = ______ X 100 140 = 71.4 % (For the aforementioned case study)
Pitch Diagram in the form of Bar Graph 1st bottleneck Process 2nd bottleneck Process Loss in balance Loss in balance (Seconds) 160 140 120 1 4 0 100 Work Allotment Time 115 110 80 85 Work Allotment Time 1 0 5 95 60 70 80 40 20 A B C D E F G H Name of worker (in the order of processes) Pitch Diagram (bar graph)
How to reduce the number of bottleneck processes (1) Investigate the relation between the bottleneck process and its previous and subsequent processes to correct the line organization. (2) Investigate whether it is possible to further divide the process. (3) Conduct the motion study for work improvement. (4) Make improvements to equipment, jig and tools. (5) Mechanize the manual work. (6) Change the positions of workers. (7) Investigate the modification to the machining specifications. (8) Make it a rule to lend the worker in charge of the bottleneck process a helping hand
Control limit (seconds) 160 Bottleneck Process 140 140 140 140 140 140 140 Upper Limit 120 115 115 115 115 115 115 Work Allotment Time 110 110 110 110 105 105 105 105 105 105 100 80 Lower Limit 95 95 95 95 140 140 140 140 140 85 80 60 70 70 40 20 A B C D E F G H Name of worker (In order of processes)
Control limit Pitch Time Upper Limit = _________________________X 100 Target organization efficiency = 0.85 = 117.6 Seconds Lower Limit = 2 x Pitch Time – Upper Limit = 2 x 100 – 117.6 =82.4 Seconds
Conclusion The contributions and incessant efforts of all the group members to complete the project report are highly appreciative. The challenging environment in 21st century demands that textile education should be meaningful and responsive to develop a mechanism to produce dynamic and technically competitive human resource in order to meet the challenges of the global world. Right and effective strategies needs to be adopted for affecting productivity with quality improvements in textile education thereby making it relevant and useful not only for the sustained growth and development of the textile institutes but also in serving the societies in a progressive way.
http://www.textilelab.blogspot.com (Visit ) My Facebook Textile related Pages 1. Yarn Manufacturing Technology Link : http://www.facebook.com/pages/Yarn-Manufacturing-Technology/485014954866808 2. Fabric Manufacturing Technology Link : http://www.facebook.com/pages/Fabric-Manufacturing-Technology/459520217425605 3. Garments Manufacturing Technology Link : http://www.facebook.com/pages/Garments-Manufacturing-Technology/472364799463126 3. Wet processing Technology Link : http://www.facebook.com/pages/Wet-Processing-Technology-Dyeing-/468645219825404 4. Fashion-Design-and-Technology Link : http://www.facebook.com/pages/Fashion-Design-and-Technology/587655294583875? ref=ts&fref=ts