Download
1 / 42
420 likes | 439 Vues
Explore the thermal analysis and energy delivery variations in PEB plates. Compare PEB #7 and PEB #8 for energy uniformity and sensor variations.

E N D
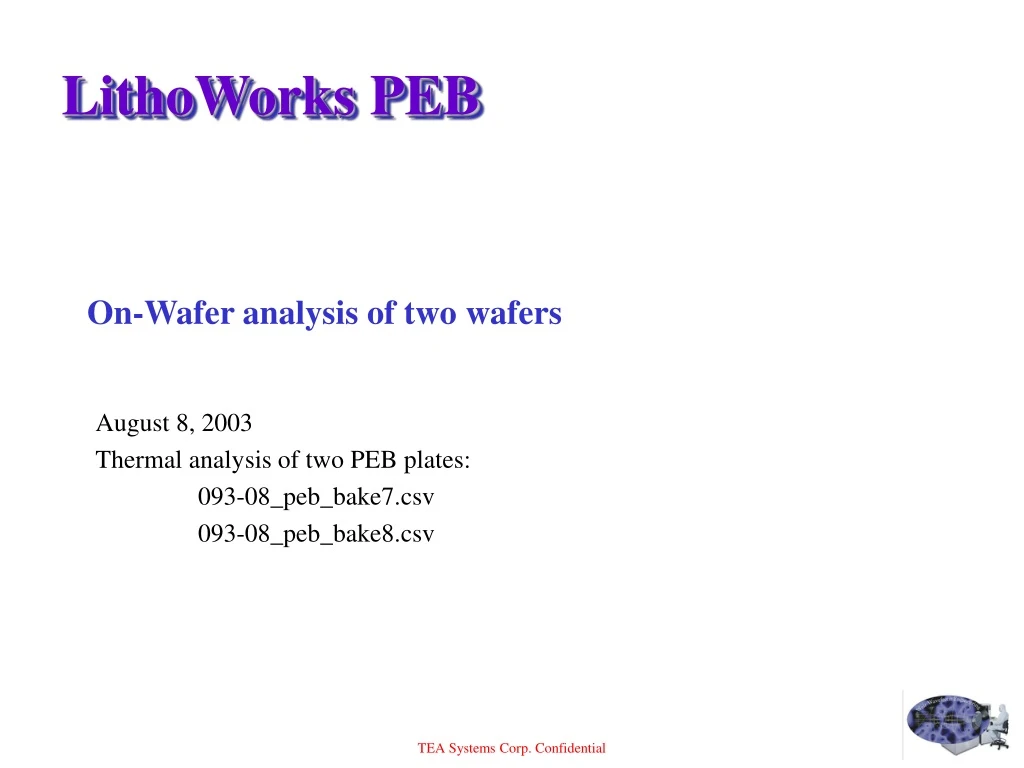
LithoWorks PEB On-Wafer analysis of two wafers August 8, 2003 Thermal analysis of two PEB plates: 093-08_peb_bake7.csv 093-08_peb_bake8.csv
PEB #7 LithoWorks PEB - Two plate study
PEB #7 overview • Left graphic • Details location of sensor points • Right graphic • Summary of rise/fall times vs temperature LithoWorks PEB - Two plate study
Sensor variation from wafer mean • Each site contains a plot of delta-temp versus time • Area • product of (degrees * seconds), summed over all sites. This is proportional to the energy entered into the wafer during the bake. • Area Variance • Energy variation across the wafer • Summed deg-sec’s over all sites reporting total variation from mean-temperature over time. LithoWorks PEB - Two plate study
Corresponding points on the graph • Moving the mouse to a point on the temp-time curve will highlight the corresponding points on the delta-temp wafer plot (50.1 sec, 113 C) LithoWorks PEB - Two plate study
On-Wafer thermal loading? Area of sensor packet • Notice how the 7 wafer-center sites are the first to rise in temperature. • Note also the two sites located over the On-Wafer sensor packed lag in heading and also lag in cooling. This area also does not reach uniformity until the end of the heading cycle. • This is most probably due to the thermal-mass loading of the sensor packet. • The red-dot on each plot marks the same relative point on each site. LithoWorks PEB - Two plate study
PEB 7; Thermal Energy Delivered • Plot of thermal area (deg-sec) across wafer. • Notice that there is a range of 168,714 deg-sec with the upper left of the wafer receiving the most energy • Thermal-package sensor area is relatively cool • No activation threshold was set for this plot thermal sensor area LithoWorks PEB - Two plate study
PEB 7; Thermal Energy Delivered • Plot of area (deg-sec) integrated over time • Notice that there is a range of 168,174 deg-sec with the upper left of the wafer receiving the most energy LithoWorks PEB - Two plate study
PEB 7: Thermal Energy Variance across wafer • Variation in energy (integrated temperature*time) delivered • Variation is greatest at wafer’s upper left corner, least in center & right. LithoWorks PEB - Two plate study
Thermal Energy Variance Across Wafer - Contour LithoWorks PEB - Two plate study
Plate PEB 8, Bake Curve • Top: PEB 8 • Bottom: PEB 7 • Curves appear very similar in shape. LithoWorks PEB - Two plate study
PEB 8; Delta-Temperature Response • Same point is marked on the time-temp curve. • Distribution in upper left of wafer is now very uniform. (50.1 sec , 113 C) LithoWorks PEB - Two plate study
Comparison PEB 8 vs PEB 7 • Time-Temp Area Differences • PEB 8 • has a higher energy area. • Exhibits greater excursion range and variation across the plate. PEB 8 PEB 7 LithoWorks PEB - Two plate study
Comparison: Delta temperature with time • PEB 8 exhibits more variation at the bottom of the wafer. PEB 8 PEB 7 LithoWorks PEB - Two plate study
PEB 8; Thermal energy delivered LithoWorks PEB - Two plate study
Thermal Energy Delivered – Bake 8 Contour LithoWorks PEB - Two plate study
Comparison: Thermal Energy Delivered – PEB 8/ PEB 7 • Both wafers as plotted on the same scale. • More thermal energy delivered to PEB 7 PEB 8 PEB 7 LithoWorks PEB - Two plate study
Thermal Energy Variation – Bake 8 Contour • Energy delivered as a delta from the wafer average temperature. • Energy = Sum((Temperature-Activation Temp.) * DeltaTime) • DeltaTime = time interval of sample LithoWorks PEB - Two plate study
PEB 8: Greatest variation in thermal energy LithoWorks PEB - Two plate study
Comparison: Thermal Energy Variation – PEB 8/ PEB 7 • Scales vary but characteristic is same • PEB 7 has has significantly better energy uniformity PEB 8 PEB 7 LithoWorks PEB - Two plate study
Comparison energy variation statistics • PEB 8 exhibits • A greater mean temperature, range and variance of temperature than PEB 7 PEB 8 PEB 7 LithoWorks PEB - Two plate study
PEB 8/ PEB 7; thermal variation • PEB 8 and 7 variations plotted to the same scale. PEB 8 PEB 7 LithoWorks PEB - Two plate study
Thermal range study Bake8 • Temperature range about the average temperature of the wafer at each time-slice. • The cycled-temperature rose a total of 98.07 degrees. • Steady state uniformity is 0.18 degree across wafer. • Notice that the wafer at 121 degrees (max. temp at 134 sec.) did not reach steady-state uniformity. LithoWorks PEB - Two plate study
Thermal range study Bake7 • Same study with PEB 7 • This study shows a red square at each transition start/stop point on the curve. LithoWorks PEB - Two plate study
Range Uniformity Summary • Plots exhibit the thermal range across the wafer at each time-slice • Both plates exhibit the same steady-state thermal resolution. • Thermal range and maximum temperatures differs by approximately one degree • Neither plate reaches steady state while at the maximum temperature. • Bake 8 has • greater across-wafer variations (9.6 v 7.0 degrees) • Greater range at the final temperature (0.9 v 0.6 degree) • Smoother cooling curves than 7 • Near identical rise/cool thermal slopes and time at the maximum temperature compared with Bake 7 • Conclusion: Bake 8 has more thermal variation across the wafer. Bake 8 Bake 7 Bake 8 LithoWorks PEB - Two plate study
Thermal Uniformity at any point in time • Generate single or matrix graphics of all of the plots. • A “movie” video will also be added to allow you to watch wafer heating. LithoWorks PEB - Two plate study
Thermal changes during the up-ramp LithoWorks PEB - Two plate study
Feature Analysis from older data sets. These data sets are not necessarily tied in with the peb 7&8 This is an attempt to see if there is any obvious correlation in the hopes that they may have been processed on one of the plates.
New Hotplate Top-CD LithoWorks PEB - Two plate study
New hotplate, PR2 variation LithoWorks PEB - Two plate study
BCD Response LithoWorks PEB - Two plate study
TCD Old LithoWorks PEB - Two plate study
Old Plate, TCD residuals to wafer LithoWorks PEB - Two plate study
Old Plate; TCD - IFD and Mean LithoWorks PEB - Two plate study
Old, PR2 Wafer LithoWorks PEB - Two plate study
Old PR2 Wafer Resids LithoWorks PEB - Two plate study
PR2 IFD and Mean for each field (wafer removed) LithoWorks PEB - Two plate study
SWA – PR1 Old Wafer LithoWorks PEB - Two plate study
SWA1 Old PEB - Wafer LithoWorks PEB - Two plate study
PR2 – SWA Wafer model LithoWorks PEB - Two plate study
PR2 – SWA Wafer Resids LithoWorks PEB - Two plate study