Download
1 / 42
430 likes | 582 Vues
A Modeling Analysis of the Clear Water Phase. CE5504 - Surface Water Quality Modeling Case History. A widespread phenomenon, following a pattern …. A distinct period of clear water typical of spring algal succession in many temperate mesotrophic and eutrophic lakes. Chlorophyll.

E N D
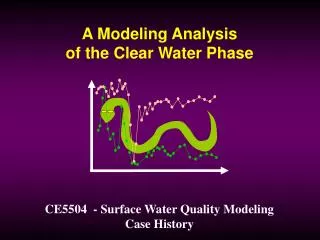
A Modeling Analysis of the Clear Water Phase CE5504 - Surface Water Quality Modeling Case History
A widespread phenomenon, following a pattern … A distinct period of clear water typical of spring algal succession in many temperate mesotrophic and eutrophic lakes. Chlorophyll Lampert, W. et al. 1986. Phytoplankton control by grazing zooplankton: A study on the spring clear water phase. Limnology and Oceanography. Secchi Disc
The PEG “Model” “ … it is assumed that events in the plankton are neither random not chaotic but that there is a seasonal development which is a predictable consequence of previous events.” Sommer et al. 1986 The Plankton Ecology Group, a working body associated with SIL, sought to construct a word model of the seasonal events which occur in the phytoplankton of an idealized ‘standard’ lake.
… well described by the Phytoplankton Ecology Group (PEG) Model Data for Onondaga Lake Auer et al. 1990 PEG 1. Towards the end of winter, nutrient availability and increased light permit unlimited growth of the phytoplankton. A spring crop of small, fast-growing algae such as Cryptophyceae and small centric diatoms develops.
… well described by the Phytoplankton Ecology Group (PEG) Model Data for Onondaga Lake Auer et al. 1990 Spada et al. 2004 PEG 4. Herbivore populations increase exponentially up to the point at which their density is high enough to produce a community filtration rate, and thus cropping rate, that exceeds the reproduction rate of the phytoplankton.
… well described by the Phytoplankton Ecology Group (PEG) Model Data for Onondaga Lake Auer et al. 1990 PEG 5. As a consequence of herbivore grazing, the phytoplankton biomass decreases rapidly to very low levels. There then follows a ‘clear-water’ equilibrium phase which persists until inedible algal species develop in significant numbers.
… well described by the Phytoplankton Ecology Group (PEG) Model Data for Onondaga Lake Spada et al. 2004 PEG 6. Herbivorous zooplanktonic species become food-limited and both their body weight per unit length and their fecundity declines. This results in a decrease in their population densities and biomasses.
… well described by the Phytoplankton Ecology Group (PEG) Model Data for Onondaga Lake Spada et al. 2004 PEG 7. Fish predation accelerates the decline of herbivorous planktonic populations to very low levels and this trend is accompanied by a shift towards smaller average body size amongst surviving crustaceans.
… well described by the Phytoplankton Ecology Group (PEG) Model Data for Onondaga Lake Auer et al. 1990 PEG 8. Under conditions of reduced grazing pressure and sustained non-limiting concentration of nutrients, the phytoplankton summer crops start to build up. The composition of the phytoplankton becomes complex both due to the increase in species richness and to the functional diversification into those species available to filter-feeders and those only consumed by specialist feeders.
… well described by the Phytoplankton Ecology Group (PEG) Model Data for Onondaga Lake Auer et al. 2004 PEG 10. From this time onward, the algal growth becomes nutrient-limited and this prevents an explosive growth of ‘edible’ algae. Grazing by predator-controlled herbivores balances the nutrient-limited growth rate of edible algal species.
modeling … from words to equations PEG 1…, PEG 4…, PEG 5…, PEG 7…, PEG 8… AQUATOX 2.0 Park, R.A., Clough, J.S. and M. Coombs Wellman. 2004. AQUATOX: Modeling Environmental Fate and Ecological Effects in Aquatic Ecosystems. Release 2. U.S. Environmental Protection Agency, Office of Water, Washington, DC.
modeling … organisms edible algae: flagellate greens small diatoms cryptomonads inedible algae: large diatoms large greens cyanobacteria dinoflagellates www.biology.mcgill.ca ceaspub.eas.asu.edu serc5.si.edu biodidac.bio.uottawa.ca www.microscopy-uk.org.uk www.bio.mtu.edu
cladoceran: Daphnia modeling … organisms prefedible = 1 prefinedible = 0 planktivore: gizzard shad prefcladoceran = 1
modeling … species composition lg gr dino crypto cyano sm diat Data for Onondaga Lake UFI; Cliff Siegrfried inedible edible
modeling kinetic coefficients edible algae Kp = 0.005 mg/L Topt = 16 °C C0 = 0.4 mg/L inedible algae: Kp = 0.025 mg/L Topt = 25 °C C0 = 0.05 mg/L Values for other coefficients used in the calibration process (Pmax, Kresp, Kmort, Ksettle) were identical for both groups.
Phosphorus (mgP∙L-1) Nitrogen (mgN∙L-1) Set initial conditions and loads to achieve saturation. modeling … nutrients
Incident Light (ly∙d-1) Latitude-specific seasonal pattern. Temperature (°C) Latitude-specific seasonal pattern. modeling … temperature
modeling … optics Secci disc transparency is estimated from the model-calculated extinction coefficient, based on a polynomial published by Effler et al. (1996): The extinction coefficient is calculated as the sum of partial extinction coefficients provided by Effler et al. (1996):
Secchi Disk (m) Set detritus to achieve ‘clearwater’ transparency. modeling … transparency
return of large-bodied Daphniids relapse modeling … target data sets Maximum Secchi Disc (m) Data for Onondaga Lake Spada et al. 2004
1985 data set ... chlorophyll and transparency M J J A S O N M J J A S O N
1985 calibration … chlorophyll dominant M J J A S O N
1985 calibration … transparency M J J A S O N
absent in 1985 1985 calibration … zooplankton
1999 data set … chlorophyll and transparency A M J J A S O A M J J A S O
1999 data set … daphniids daphniids Gmax = 1.6 g/g·d Topt = 20 °C C0 = 0.01 mg/L A M J J A S O Other coefficients used in the calibration process included Kresp and Kmort.
1999 calibration … daphniids A M J J A S O
A M J J A S O 1999 performance … chlorophyll
1999 performance … transparency A M J J A S O
1999 performance … species composition model data
2003 simulation …planktivore added • cladocerans essentially eliminated • much slower attenuation of edible forms • dominated by edible algae
2003 simulation …planktivore added • absence of clear water phase
… rabbits running, Part 1: time-variable TSS time-variable TSS The base case TSS is ramped down from 3 mg/L to 0.3 mg/L during the clearing event, Neither level, held constant permits successful simulation of transparency over the season. This suggest that non-specific grazing (tripton consumption) may play a role in the magnitude of the transparency increase observed in clearing events. TSS = 3 mg/L TSS = 0.3 mg/L
A M J J A S O … rabbits running, Part 2: Aphanizomenon … the model fails to capture a late June crash in chlorophyll
… rabbits running, Part 2: Aphanizomenon the population crashing was a genus of cyanobacteria, Aphanizomenon, an inedible form. The crash freed resources for two edible groups (small diatoms and cryptomonads) …
… rabbits running, Part 2: Aphanizomenon and a second daphniid peak resulted … A M J J A S O
A M J J A S O … rabbits running, Part 2: Aphanizomenon … bottoming out the chlorophyll
… rabbits running, Part 2: Aphanizomenon … an yielding a second clearing event A M J J A S O
“Pay no attention to the modeler behind the curtain.” … we have our ways to deal with running rabbits
The PEG word model and the AQUATOX software package provide a framework for the successful simulation of the clearing event phenomenon and for phytoplankton-transparency relationships in non-clearing event years. Certain features of the simulation, particularly the demise of cyanobacteria populations and the role of non-specific grazing in driving clearing events, are not well understood … reminding us that nature remains the master modeler. Conclusions