Analysis of Ocean Trajectories with MOM3 vs. Levitus94 Climatology
An analysis using ARGO data on the abilities of GFDL MOM3 to simulate ocean temperature and salinity in the western Pacific compared to Levitus94 climatology. Results show correlations between observed, modeled, and climatological data, highlighting biases and potential improvements.

Analysis of Ocean Trajectories with MOM3 vs. Levitus94 Climatology
E N D
Presentation Transcript
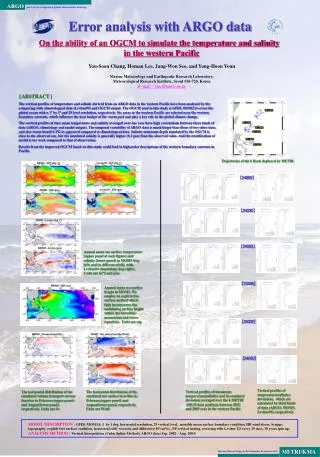
Trojectories of the 6 floats deployed by METRI. Levitus94 : SST (deg. C) MOM3 : SST (deg. C) [24893] Levitus94 : SSS (psu) MOM3 : SSS (psu) [24330] MOM3 - Levitus (deg. C) [24060] MOM3 - Levitus (psu) Annual mean sea surface temperature (upper panel at each figure) and salinity (lower panel) in MOM3 (top left) and its difference(left) with Levitus94 climatology (top right). Units are in ℃ and psu . [23445] MOM3 : SSH (cm) Annual mean sea surface height in MOM3. We employ an explicit free surface method which fully incorporates the undulating surface height within the baroclinic momentum and tracer equations. Units are cm. [24332] MOM3 : Stream function(Sv) MOM3 : Net surface heat flux(W/m2) [24062] The horizontal distribution of the simulated volume transport stream function in February(upper panel) and August(lower panel) respectively. Units are Sv. The horizontal distribution of the simulated net surface heat flux in February(upper panel) and August(lower panel) respectively. Units are W/m2. ARGOpart of the integrated global observation strategy Error analysis with ARGO data On the ability of an OGCM to simulate the temperature and salinity in the western Pacific You-Soon Chang, Homan Lee, Jang-Won Seo, and Yong-Hoon Youn Marine Meteorology and Earthquake Research Laboratory, Meteorological Research Institute, Seoul 156-720, Korea E-mail : you@metri.re.kr [ ABSTRACT ] The vertical profiles of temperature and salinity derived from an ARGO data in the western Pacific have been analyzed by the comparing with climatological data (Levitus94) and OGCM output. The OGCM used in this study is GFDL MOM3.0 covers the global ocean with a 1 by 1 and 29 level resolution, respectively. Six areas in the western Pacific are selected near the western boundary currents, which influence the heat budget of the warm pool and play a key role in the global climate change. The vertical profiles of time mean temperature and salinity averaged over one year have high correlations between three kinds of data (ARGO, climatology and model output). The temporal variability of ARGO data is much larger than those of two other data, and also warm bias(0.5-1℃) is appeared compared to climatological data. Salinity minimum depth simulated by the OGCM is close to the observed one, but the simulated salinity is generally higher (0.2 psu) than the observed value. And the stratification of model is too week compared to that of observation. Results from the improved OGCM based on this study could lead to high-order descriptions of the western boundary currents in Pacific. Vertical profiles of temperature(salinity) deviations, which are calculated by third kinds of data (ARGO, MOM3, Levitus94), respectively. Vertical profiles of time-mean temperature(salinity) and its standard deviation averaged over the 6 METRI ARGO data positions between 2002 and 2003 year in the western Pacific. MODEL DESCRIPTION : GFDL MOM3.0, 1 by 1 deg. horizontal resolution, 29 vertical level, monthly mean surface boundary condition, HR wind stress, Scripps topography, explicit free surface condition, horizontal eddy viscosity and diffusivity(107cm2/s) , PP vertical mixing, restoring with Levitus T,S every 30 days, 30 years spin up. ANALYSIS METHOD : Vertical Interpolation (Cubic Spline Method), ARGO data (Sep. 2002 – Aug. 2003) METRI/KMA Marine Meteorology & Earthquake Research Lab.