Exploring Methods of Data Organization and Visualization in Information Systems
This lecture by George Legrady delves into the significance of organizing data to create meaningful information in classification systems. It discusses various data structures, including relational models, hierarchical trees, and network models. Emphasizing the impact of organization on interpretation, the lecture explores classification methods and the role of metadata in enhancing data utility. Additionally, it touches upon the interplay of innovative organizational forms and cultural context, providing insights into visualization and accessibility in data exploration and media representation.

Exploring Methods of Data Organization and Visualization in Information Systems
E N D
Presentation Transcript
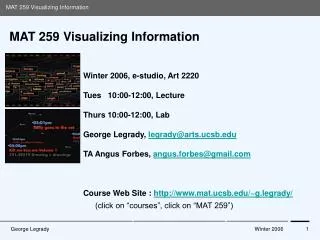
MAT 259 Visualizing Information Systems of Classification • Lecture 3, January 24, 2006 George Legrady
Systems of Classification • We make sense of the world through organization • We organize according to rules, systems (Linnaeus) • but also according to experience (associative) George Legrady
Database/Data Structures • A Database is an organized collection of data • A collection of records stored in a systematic way • Each record, a set of data elements, (basic unit of data such as name, street address, city, zip) • Retrieval through any of the data elements • Relational model: all data represented in terms of mathematical relationships George Legrady
Hierarchical Tree Structure Model • Frequently hierarchical in structure, requiring parent/child relationship definitions • Organization of computer hard drive • Internet, WWW • Dewey Decimal System • Cladistics: evolutionary relationships (cladograms) George Legrady
Network Model • Each record can have multiple parents and child records • Organized in lattice structure consisting of links and nodes • Lends easily to spatial visualization • Example: Kohonen SOM map George Legrady
Organization of Data (Shedroff) • Data is the result of research, collection, discovery, creation • Data in itself is not very useful • Its value is a result of how it is organized, transformed, and presented to give it meaning • Context determines meaning for data George Legrady
From Data to Information • 1st step: explore its organization • Organization affects interpretation and understanding • Variations in the organization of the same data set express different attributes and messages George Legrady
Classification Methods • Alphabetical: arbitrary learned system • Numeric: arbitrary learned system • Scalar: (hotel star system) implies value scale • Sequential (time): based on units • Spatial: “sense of place” • Categories: similar things grouped together • Associative: (If a to b, then c to d) • Metaphoric: A way to establish context • Random: Creates complexity (game beginnings) George Legrady
Metadata • Data about data: Information that describes another set of data • Examples: Library catalog card, address book, etc. • Metadata is what allows the organization, storage, retrieval of data George Legrady
Lo & Hi Metadata • Example LO: Resolution, compression in a digital video file • Example HI: describes the structure of a media composition, ultimately its semantics • LO to HI Transition: from metadata as tool to cultural form through semantic description George Legrady
Standards • Library of Congress: http://www.loc.gov/standards/ • Marc Standards: http://www.loc.gov/marc/ • Dublin Core: a metadata standard for describing digital objects (including webpages) to enhance visibility, accessibility and interoperability, often encoded in XML • Harmony Project: research methods and models for describing the variety of rich content http://metadata.net/harmony/ George Legrady
Explorative & Innovation • To see same data sets in different organizations reveals unexpected patterns in the relationship of things • To invent new forms of organization based on personal, or idiosynchratic rules enhances novelty of experience • Nonetheless there needs to be some cultural common ground • Invention is always a conversation with the conventional George Legrady
Aesthetic Examples • Associative: Lisa Jevbratt 1:1 • Biographical: Daniel Spoerri’s Anecdoted Topography of Chance • Affect: Melanie Wein’s http://www.the-fleetingness-of-bits.de/ George Legrady
Data & Media Exploration Areas • Large Scale data sets • New Structure: data with high-metadata content • New Interface: Navigation & efficient access • New Image: New forms of visualization • Experimentation: Trial & error process George Legrady
References • Library of Congress, http://www.loc.gov/marc/ • http://dublincore.org/ • http://metadata.net/harmony/ • Savage Mind (Science of the Concrete), Levi-Strauss • “Metadating the Image” Lev Manovich • http://time.arts.ucla.edu/AI_Society/manovich.html • http://time.arts.ucla.edu/AI_Society/daniel.html George Legrady