Download
1 / 11
110 likes | 192 Vues
Study on vorticity structure in Hurricane Rita focusing on observational evidence, vortex Rossby waves, methodology improvements, and key science questions. Investigating radial mean vorticity profiles and vortical wave modes.

E N D
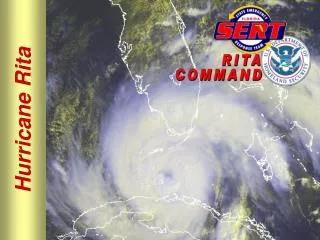
Observed Vorticity Structure in Hurricane Rita (2005)Methodology Improvements Michael M. Bell National Center for Atmospheric Research/ Earth Observing Laboratory Colorado State University Wen-Chau Lee National Center for Atmospheric Research/ Earth Observing Laboratory
Vortex Rossby Waves • Waves retrograde and propagate outward when the radial gradient of mean vorticity is negative, similar to observed spiral bands in hurricanes (Montgomery & Kallenbach 1997) • Vorticity perturbations can change mean intensity via wave-mean flow interaction at a critical radius r* • Mesovortices can mix eye-eyewall air and provide a ‘turboboost’ to the hurricane engine (Persing & Montgomery, 2003; Bell & Montgomery, 2006)
Radial Mean Vorticity Profiles • ELDORA’s 300 - 500 m spatial resolution can yield new insights into the 2D mean and 3D perturbation vorticity Reasor et al (2000); Mallen et al (2005)
Methodology • Obtain u, v, w & Z in Cartesian space from dual-Doppler analysis using variational synthesis (Gamache, 1997) • Determine vortex center and mean wind at each altitude (Marks et al, 1992) • Convert to cylindrical coordinates • Determine azimuthal mean and perturbation quantities Hildebrandt et al. 1986
Methodology Improvements • Do a first pass through the data and set the time of closest approach (TCA) to each gridpoint. • Restrict the closest approach of the beginning and ending of the track to either side of an azimuthal line • Define a 4-minute window from which data can be added to a gridpoint based on the time of closest approach. • Remove a small wedge (1-5 degrees) of data near the track overlap.
Key Science Questions • Can we find observational evidence of VRWs and their contributions to intensity change in a moist-baroclinic-nonlinear-forced-dissipative vortex? • Empirical Normal Modes (Brunet, 1994; Chen et al, 2003) • Where is the critical radius for wave-mean flow interaction? • Is this radius a dynamically preferred region for secondary eyewall formation/growth? • Which spatial scales are the most important? (low azimuthal wavenumber vs. convective, 3D structure of filaments)
Empirical Normal Modes Chen et al (2003) • Pseudomomentum and Pseudoenergy modes are orthogonal • ENM analysis allows for separation of vortical wave modes (VRWs) and their contribution to E-P flux